Learning Goals
In this support activity you’ll become familiar with the following:
- Compare a single variable across groups using dotplots.
- Compare a single variable across groups using histograms.
You will also have an opportunity to refresh the following skills:
- Read and interpret a dotplot.
- Read and interpret a histogram.
In the next section of the course material you will refresh your knowledge of mean and median by calculating them for a small data set. In the following activity, you’ll use technology to calculate them for larger data sets in order to read, interpret, and make comparisons of centers between histograms. In this support activity, you’ll review reading and interpreting graphs that display the distribution of quantitative data, dotplots and histograms.
Illustrating Frequency with Dotplots
Let’s begin by re-visiting data from a sleep study [1] of college students that we saw in Forming Connections in Displaying Categorical Data: 3A. We’ll explore and compare the distributions of a few of the numerical variables from the study, including alcoholic drinks consumed per week, hours of sleep per night on the weekends, and classes missed in a semester.
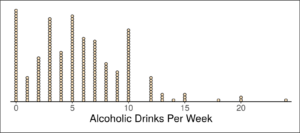
Below we are given a dotplot for the variable Alcoholic Drinks Per Week. Recall that a dotplot is used to display the frequency and distribution of a quantitative variable. Use this dotplot to answer Questions 1-3.
Recall
You may wish to refresh your understanding of how data is represented in a dotplot.
Core skill:
In order to use a graphical display to answer questions about the data set, it helps to first ask yourself a question or two to become familiar with the visualization. We’d like to know what information this dotplot conveys about the participating students in the study. Then we can use it to answer questions about the data.
question 1
Now that you are familiar with the information presented in the display, you can use it to answer questions about the data.
question 2
question 3
- Onyper, S. V., Thacher, P. V., Gilbert, J. W., & Gradess, S. G. (2012). Class start times, sleep, and academic performance in college: A path analysis. Chronobiology International, 29(3), 318-335. ↵
