Learning Goals
After completing this section, you should feel comfortable performing these skills.
- Calculate the mean of a small data set by hand.
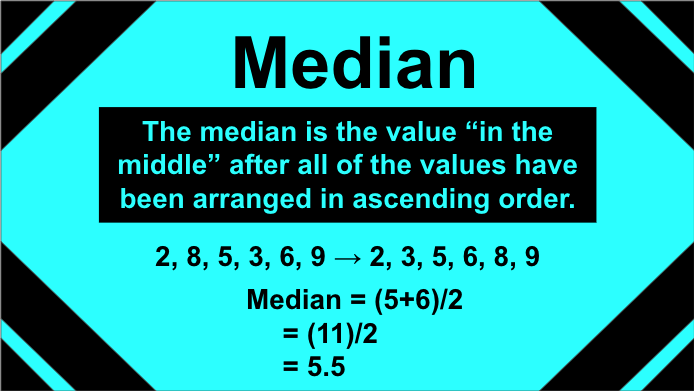
- Calculate the median of a small data set by hand.
- Use a data analysis tool to calculate the mean of a large data set.
- Use a data analysis tool to calculate the median of a large data set.
- Estimate the mean of a data set by examining a histogram of its distribution.
- Estimate the median of a data set by examining a histogram of its distribution.
- Use a data analysis tool to calculate and compare the mean and median for multiple groups at once.
- Use a histogram to estimate and compare centers for multiple groups.
Mean
In the next activity, you’ll need to use technology to calculate the mean and median of numerical data in order to compare groups. You will also need to interpret histograms to estimate the mean and median of a data set. Get some practice with these skills in this section.
Calculating Mean and Median
Recall
You’ve probably seen the terms mean and median before. Before we discuss in detail how to calculate them, take a minute to see if you can recall doing it before. Do you remember how these terms are defined?
Core skill:
In most of the activities that follow, we’ll be using technology to calculate the mean and median of large data sets. A close look at the notation of the mean and a refresher of how to calculate the median, though, will be helpful before you move forward. Much of the statistics presented in this course involves mathematical notation. The symbols used can appear similar, which causes some confusion until they become familiar to you. It will be helpful to spend some time getting to know the mathematical notation for the mean and practice calculating means and medians of small data sets by hand.
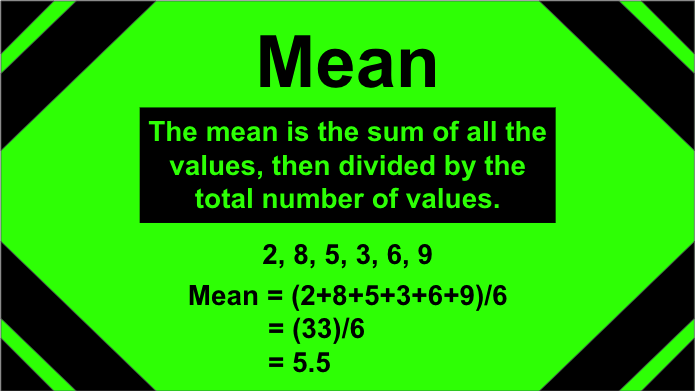
Mean
Calculating the Mean by Hand
Need a video demo of the notation and translation of it to the example given below (students know how to get the average — it’s the notation for which they have no existing cognitive anchor).
Mean
You may recall from a previous mathematics or statistics class that the mean of a data set can be computed by summing the data values and dividing by the number of values,
[latex]\text{mean } = \dfrac{\text{sum of data values}}{\text{total number of data values}}[/latex]
or more formally,
[latex]\bar{x}=\dfrac{\sum{x}}{n}[/latex]
where [latex]\bar{x}[/latex] is the mean, [latex]\sum[/latex] is the symbol for “sum of,” [latex]x[/latex] represents the data values, and [latex]n[/latex] is the total number of data values.
Example
Let’s consider this small set of data values:
[latex]3.3\qquad 0.8\qquad 5.8\qquad 10.0\qquad 3.6\qquad 8.7\qquad 0[/latex]
First, you need to find the sum by adding all the values.
[latex]3.3+.8+5.8+10+3.6+8.7+0=32.2[/latex]
Next, count how many values were in the data set. Here there are [latex]7[/latex] values (zero is still a value1).
Then, divide the sum these numbers by how many values there are.
[latex]\bar{x}=\dfrac{3.3+.8+5.8+10+3.6+8.7+0}{7}=\dfrac{32.2}{7}=4.6[/latex]
From this calculation, we determine that the mean is [latex]4.6[/latex].
Try It 1
Calculate the mean of each small data set below.
a) [latex]7, 4, 8, 2, 3, 6[/latex]
b) [latex]1.2, 3.9, 5.3, 4.2[/latex]
c) [latex]79, 86, 92, 93, 88[/latex]
