Simple Random Sample
Suppose that instead of selecting a representative sample by eye, each student used a random number generator to select a simple random sample of 10 words. A simple random sample relies on a random mechanism to choose a sample, without replacement, from the population so that every sample of size 10 is equally likely to be chosen. “Without replacement” is a common term in probability and statistics that means once an individual from the population is selected for the sample, that individual cannot be replaced and re-selected for the same sample.
To use a random number generator to select a simple random sample, you will need a numbered list of all the words in the population, called a sampling frame. You can then generate 10 random numbers from the numbers 1–431 (the number of words in the population); the chosen random numbers correspond to the chosen words in your sample. The sampling frame for the speech excerpt can be found linked below.
Sampling frame for Justice Sotomayor’s speech excerpt. [link to this here–it is located at the bottom of the DC activity page.]
Work individually to complete Question 7. You’ll find a random number generator app linked in Question 7. Follow the directions given in the question to generate a list of ten random numbers. Then, locate those numbers and their associated words in the sampling frame. Finally, copy those words and their lengths into the table in Question 7.Compute the mean of your sample and record this value in Question 8.
question 7
Use the sampling frame indicated above to complete this question.
Step 1) Go to the Generate Random Numbers tool at https://dcmathpathways.shinyapps.io/RandomNumbers/
Step 2) Select the Random Numbers tab.
Step 3) Under Choose Minimum, type 1 and under Choose Maximum, type 431.
Step 4) Type 10 for how many numbers do you want to generate? and choose no for sample with replacement?
Step 5) Click Generate to select a simple random sample from the population of all 431 words in the excerpt. Fill in the following table with the random numbers selected and each number’s corresponding word and word length (number of letters/digits in the word).
| Observation | Random Number | Word | Length |
| 1 | |||
| 2 | |||
| 3 | |||
| 4 | |||
| 5 | |||
| 6 | |||
| 7 | |||
| 8 | |||
| 9 | |||
| 10 |
question 8
8) Compute the mean (i.e., average) word length in your sample in Question 7. Is this value a parameter or a statistic?
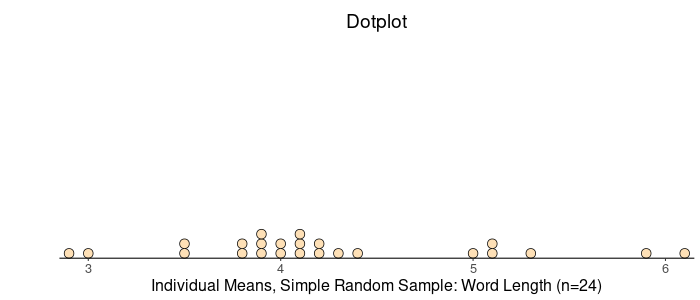
Your instructor may now collect the means you obtained from your simple random samples of word length from the excerpt and display them in a dotplot. Here is an example of what the graph might look like for a class of 24 students. Follow your instructor’s directions to answer Questions 9 – 10. You may work with a partner on these questions.
question 9
9) Your instructor will guide the class in creating a visualization of the results generated by your class using the random number generator. Draw a picture of the plot here. Include a descriptive label for the horizontal axis label.
question 10
The true mean word length of the population of all 431 words in the excerpt is 4.68.
Part A: Is this value a parameter or a statistic?
Part B: Where does this value fall on the plot created in Question 5?
Part C: Where does this value fall on the plot created in Question 9?
Guidance
[Sub-summary: What did you find out about where the true population mean fell in comparison to the dotplot of the first sample means (the ones created “by eye”) and the second graph of means of the simple random samples? Which set of means turned out to be closer to the true population mean? It appears that our collection of samples we thought was random at first, must have tended to overestimate the word length of the excerpt. In Questions11 – 13, you’ll explore why the first set of samples tended to overestimate the true population mean and consider reasons why the simple random samples you collected tended to produce representative samples. It’s that tendency that causes a sampling method to be biased or unbiased: whether or not it tends to produce representative samples. ]
Work in small groups to complete this activity. Compare the two graphs to answer Question 11.
question 11
11) How does the plot generated in Question 9 compare to the plot generated in Question 5? Which features are similar? Which features differ? Why didn’t everyone get the same sample mean?
