Standard Deviation
In statistics, we are particularly interested in understanding how data are distributed and where each observation is in reference to the mean. This measurement of variability is called standard deviation, which tells us how spread out observations are from the mean. The symbol we use to denote standard deviation differs depending on whether we are discussing a sample or a population. We use the Greek letter [latex]\sigma[/latex] (sigma) to denote the standard deviation of a population of observations. We use the Latin letter [latex]s[/latex] to denote the standard deviation of a sample of observations.
Recall
We’ll be using statistical formulas, symbols, and language to discuss measures of variability. Take a moment to recall the formula you learned to calculate the mean of a sample. What symbols do we use to represent sample mean, summation, and sample size?
Core skill:
Standard Deviation VIDEO ANIMATED CONCEPT
video about standard deviation and why we find it and it’s purpose
Standard Deviation
The following formulas are used to calculate the standard deviation of a population and a sample:
Standard deviation of a population: [latex]\sigma = \sqrt{\dfrac{\sum \left(x-\mu\right)^2}{n}}[/latex], where [latex]\mu[/latex] represents the population mean.
Standard deviation of a sample: [latex]s=\sqrt{\dfrac{\sum \left(x-\bar{x}\right)^2}{n-1}}[/latex], where [latex]\bar{x}[/latex] represents the sample mean.
The following steps can be applied to calculate a standard deviation by hand:
- Calculate the mean of the population or sample
- Take the difference between each data value and the mean, then square each difference
- Add up all the squared differences
- Divide by either the total number of observations in the case of a population, or by 1 fewer than the total in the case of a sample
- Take the square root of the result of step 4
example
A sample of observations is listed below. Find its standard deviation.
[latex]8, 7, 13, 15, 23, 18[/latex]
DATASET CHOICE OPTION
Here is a breakdown of the formula for standard deviation of a sample, [latex]s[/latex].
[latex]s=\sqrt{\dfrac{\sum \left(x-\bar{x}\right)^2}{n-1}}[/latex]
- The distance from each observation to the mean is known as a deviation from the mean and is expressed as [latex]\left(x-\bar{x}\right)[/latex]
- The deviations from the mean are squared in the formula because some observations are above the mean, thus [latex]\left(x-\bar{x}\right)>0[/latex] (the difference is positive), and some observations are below the mean, thus [latex]\left(x-\bar{x}\right)<0[/latex] (the difference is negative). Squaring ensures the differences will each be expressed as positive distances and won’t cancel each other out when summed up.
- The [latex]\sum[/latex] symbol sums up the squared deviations for all [latex]n[/latex] observations.
- The denominator in the formula for a sample standard deviation is [latex]\left(n-1\right)[/latex] rather than [latex]n[/latex] as in the formula for the population standard deviation.
- Why do we divide by 1 fewer than the sample size, [latex]\left(n-1\right)[/latex]?
The answer to that is complicated, but here are some ideas that may help
- The square root is taken in order to express the spread in terms of the units of the observations. Recall that we squared the differences to express them as positive distances, which resulted in squared observation units. Taking the square root can be thought of as “undoing” the earlier squaring. For example, assume that within the context in which you are working, the data are in terms of dollars. If we do not take the square root, the standard deviation will be in terms of dollars squared, which is not something commonly used.
- The standard deviation, [latex]s[/latex], represents the “typical” distance of an observation from the mean of the data set.
Standard Deviation VIDEO WITH INSTRUCTOR CHOICE
[perspective video — a 3-instructor video showing how to think about standard deviation as a measure of variability. Cover the parts of the formula (go into why squaring, why df if desired) but emphasize the concept of variability from std dev and variance more so than the technical use of the formula.]
Although it’s important to understand each part of the formula – don’t worry – we will be using the statistical technology tool to calculate standard deviation for us! Let’s practice using tool by finding the standard deviation of the variable Average Sleep in the Sleep Study data set.
Try It 5
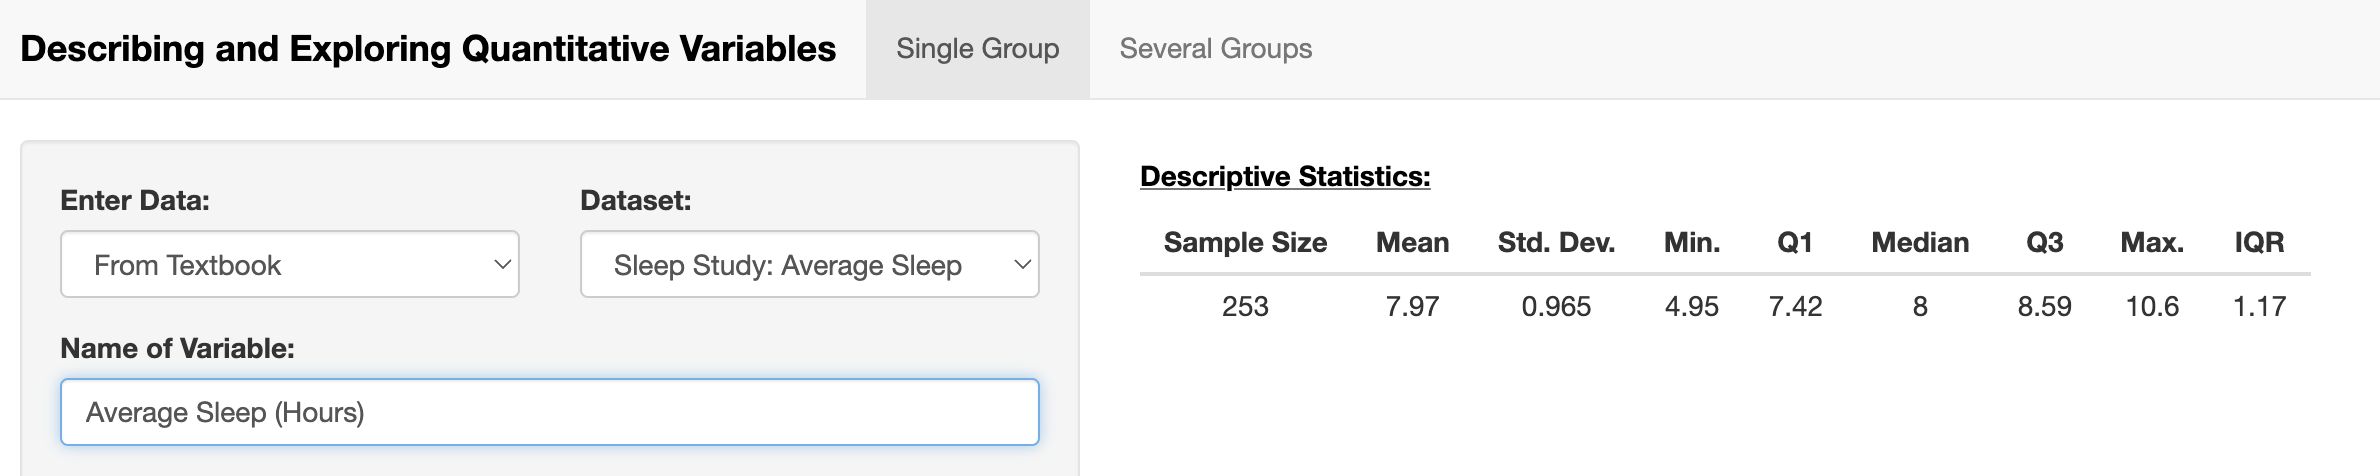
Step 1) Select the Single Group tab.
Step 2) Locate the drop-down menu under Enter Data and select From Textbook.
Step 3) Locate the drop-down menu under Data Set and select Sleep Study: Average Sleep.
Hint
- Why do we divide by 1 fewer than the sample size, [latex]\left(n-1\right)[/latex]?
