Learning goals
In this support activity you’ll become familiar with the following:
- Read and interpret bar charts that represent percentages.
- Read and interpret stacked bar charts.
- Express absolute change in percentages.
- Express relative change in percentages.
You will also have an opportunity to refresh the following skills:
In the next section of the course material and in the following activity, you will need to be able to interpret data presented in side-by-side and stacked bar charts. Prepare for that in this support activity by practicing working with data presented as percentages. At the end of the activity you’ll also compute absolute and relative changes in percentages. That part can be tricky. Follow the Recall box and question hints for help along the way. You may also wish to refer to Fractions, Decimals, Percentages.
Bar Charts
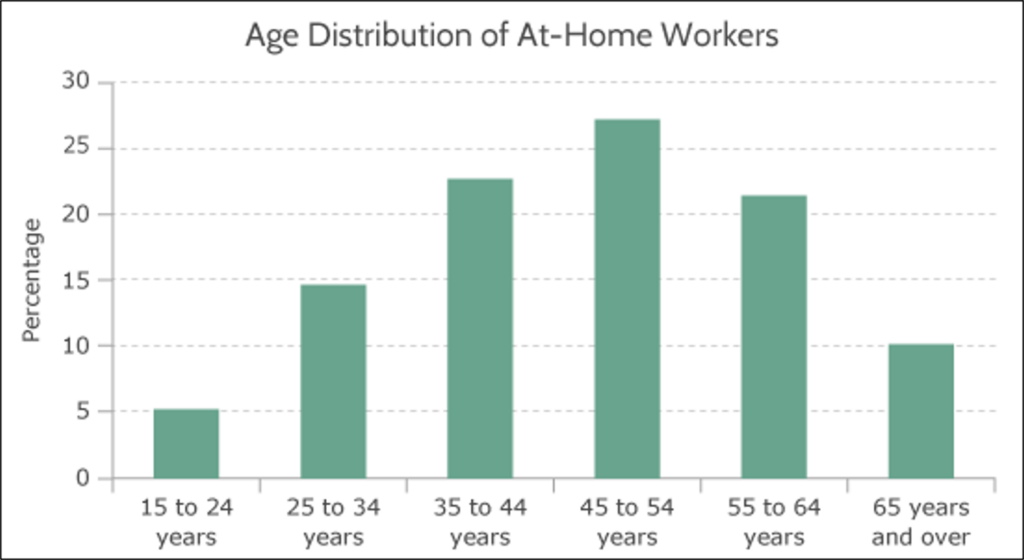
You worked with bar graphs (also called bar charts) recently in What to Know About Displaying Categorical Data: 3A. The graphs in that page displayed several bars, each representing a different categorical variable. The height of the bar represented that category’s associated frequency (count). The graphs we’ll look at in this activity are similar to the ones you saw there, but instead of the bar heights representing counts, these will represent percentages. Let’s take a close look at the first graph below, Age Distribution of At-Home Workers, as an example.
interactive example
- According to the graph, what percent of at-home workers were [latex]15[/latex] to [latex]24[/latex] years old?
- Which age range of workers makes up nearly [latex]15\%[/latex] of at-home workers?
- What percent of at-home workers are at least [latex]65[/latex] years old?
The graph below shows data from the U.S. Census Bureau on at-home workers in the United States in 2010. [1] Note that age ranges are listed along the horizontal axis and percentages are marked along the vertical axis. The graph displays the percentages of all workers, separated by age ranges, who worked at home at least one full day during a typical work week in 2010 (at-home workers).
Use this graph to answer the questions below.
question 1
question 2
question 3
question 4
- Mateyka, P. J., Rapino, M. A., & Landivar, L. C. (2012, October). Home-based workers in the United States: 2010. United States Census Bureau. https://www.census.gov/prod/2012pubs/p70-132.pdf ↵
