Variability
Let’s use a data set of movie runtimes to explore variability using the statistical technology tool.
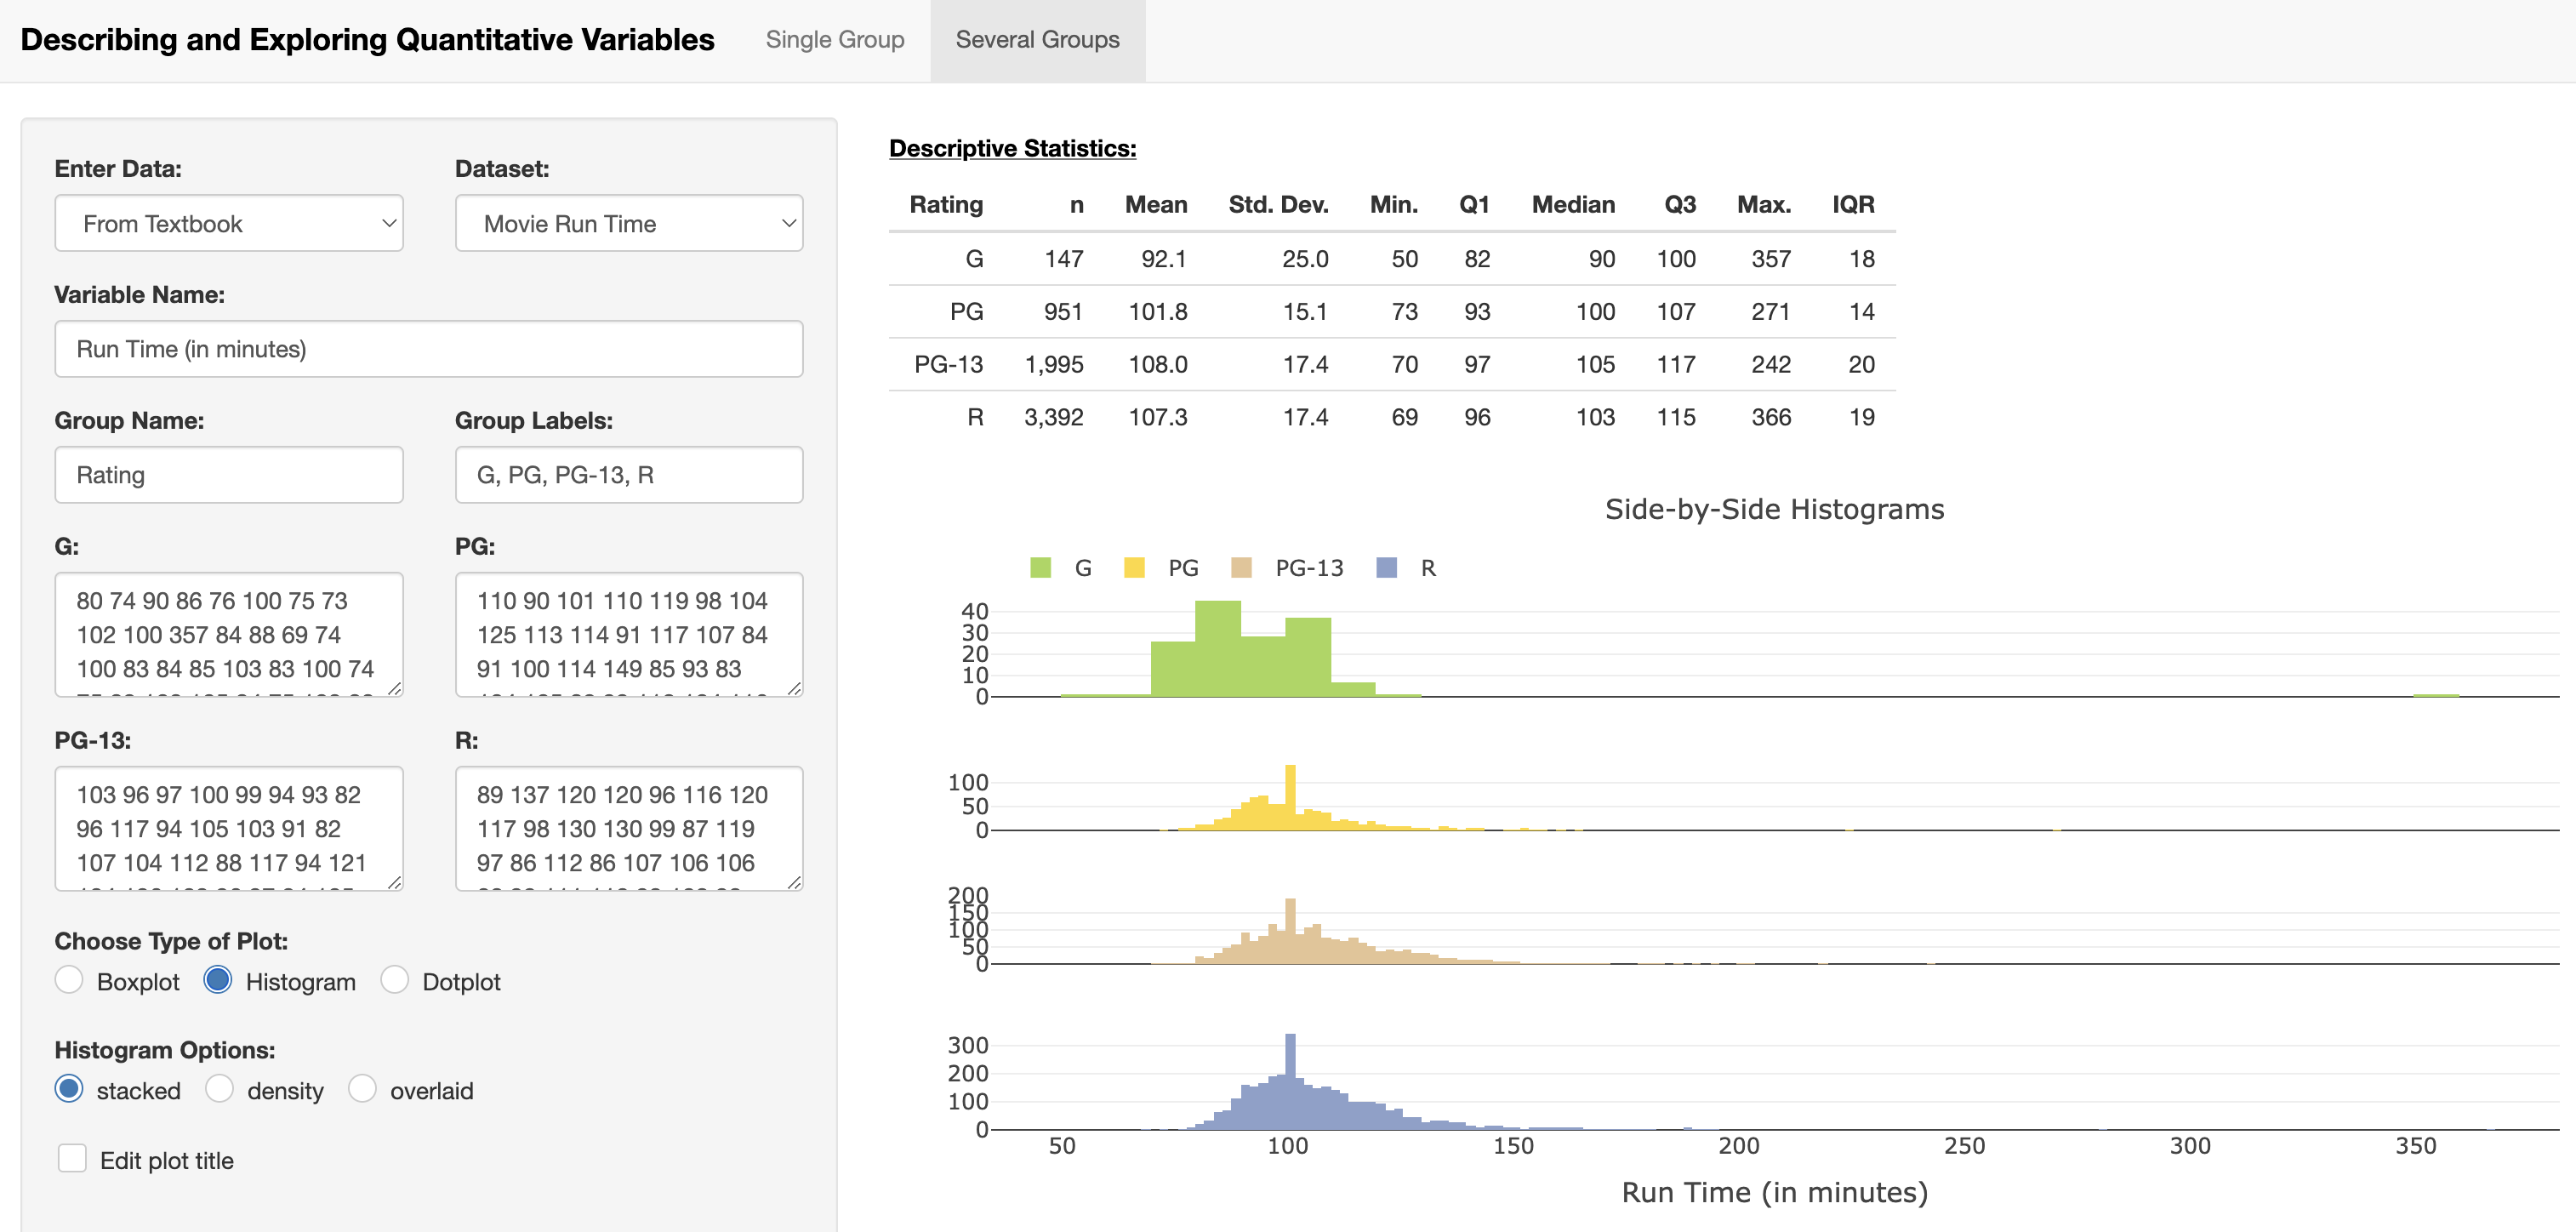
Step 1) Select the Several Groups tab.
Step 2) Locate the drop-down menu under Enter Data and select From Textbook.
Step 3) Locate the drop-down menu under Data Set and select Movie Run Time.
question 2
Hint
Make sure the Several Groups tab is selected and refer to the Descriptive Statistics. Recall that variance is the square of standard deviation.
question 3
Hint
Which type of display helps you see the spread of larger data sets more clearly? How much space does the data take up?
question 4
Hint
Look at the distributions as histograms and as dot plots. Which is easier for seeing extreme values? Do you see anything of interest when viewing the dot plots?