Learning Goals
After completing this section, you should feel comfortable performing these skills.
- Interpret the median of a data set.
- Interpret the mean of a data set.
- Identify whether a data set is left-skewed, symmetric, or right-skewed.
- Identify in which data set the mean is greater than, less than, or approximately equal to the median.
- Identify which of the mean or median is resistant to skew.
Click on a skill above to jump to its location in this section.
When examining the distribution of a quantitative variable using a histogram or a dotplot, we often find that the distribution follows a bell shape with a mound of observances in the middle of the distribution and even amounts of data falling to the right and left. But sometimes a distribution’s values are bunched up to one side or the other, with a few observations stretching way out to the other side. You may recall from What to Know About Applications of Histograms: 3D that there are specialized statistical terms we use for these different distribution shapes: skewness and symmetry. In this section, you’ll learn that there are certain ways the mean of the data relates to the median under these different shapes.
Skewness
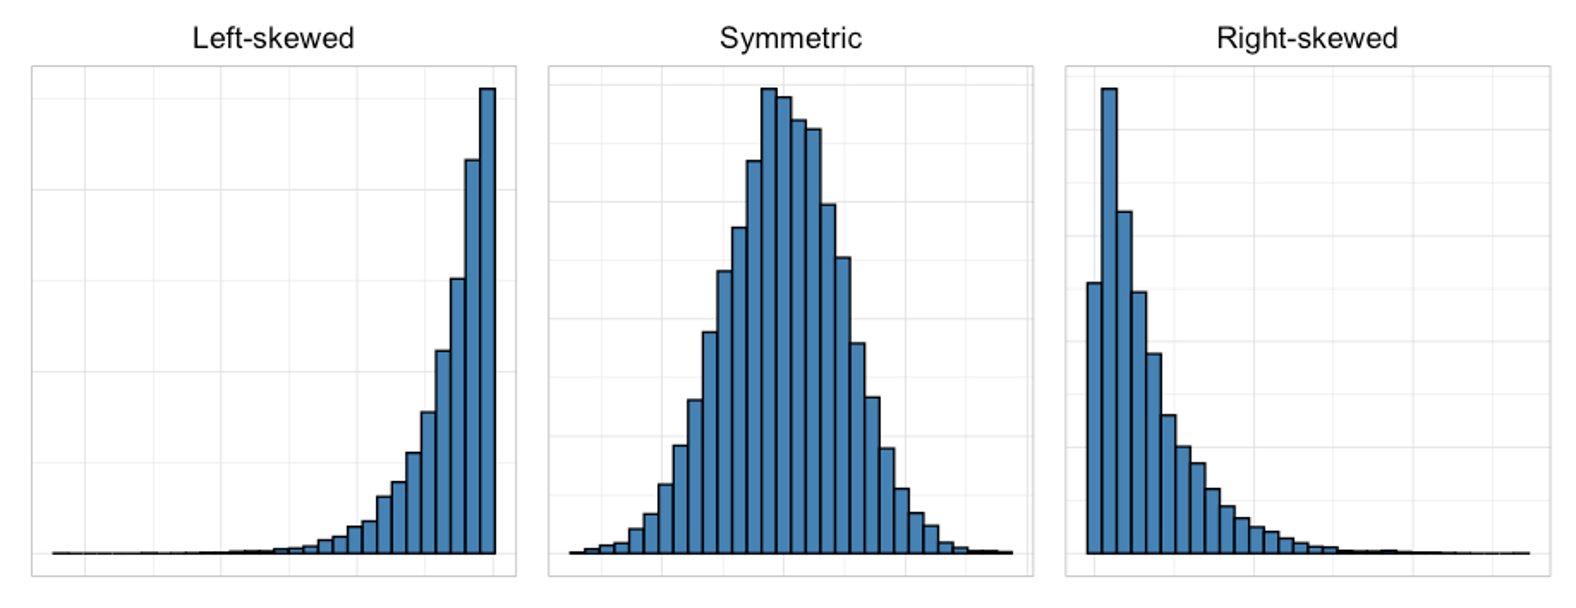
Recall that we say a quantitative variable has a right-skewed distribution or a positive skew if there is a “tail” of infrequent values on the right (upper) end of the distribution. We say a data set has an approximately symmetric distribution if values are similarly distributed on either side of the mean/median. We say a data set has a left-skewed distribution or a negative skew if there is a “tail” of infrequent values on the left (lower) end of the distribution.
Refresh your memory for how to describe the shape of a histogram by trying the question in the interactive example below.
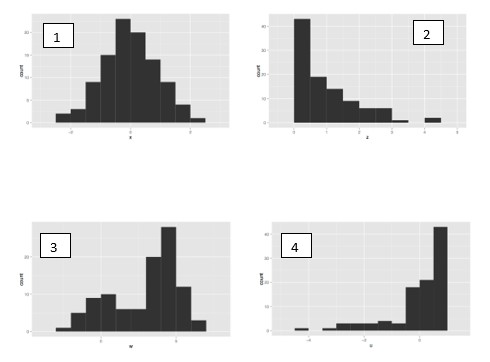
interactive example
Several histograms are displayed below. Provide a description of the shape of each.
In the next activity, you’ll need to calculate and interpret the mean and median in skewed distributions. Let’s get some practice with these skills using data collected around the T.V. show Friends.
