Interpreting the Mean and Median of a Data Set: Learn It 3

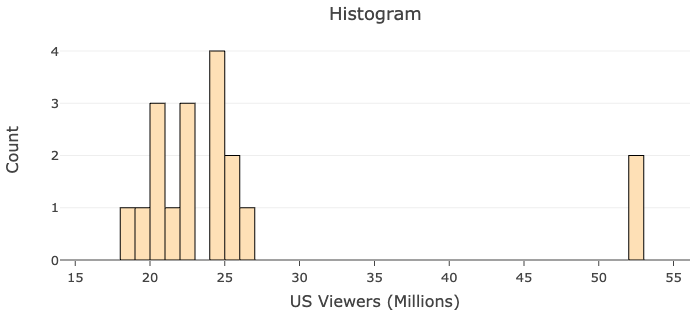
For this question, use the following histogram of the Season 10 Friends viewership data.

A histogram labeled "US Viewers (Millions)" on the x-axis and "Count" on the y-axis. The x-axis is numbered in increments of five from 15 to 55 and the y-axis is numbered in increments of 1 from 0 to 4. For 18-19, the count is 1. For 19-20, the count is 1. For 20-21, the count is 3. For 21-22, the count is 1. For 22-23, the count is 3. For 24-25, the count is 4. For 25-26, the count is 2. For 26-27, the count is 1. For 52-53, the count is 2. For all other ranges, the count is 0.

question 6

question 7

question 8

question 9