Learning Goals
During this activity, you will:
- Use measures of center to draw conclusions about two variables over a single group
- Use measures of center to draw conclusions about two variables over multiple groups
Click on a skill above to jump to its location in this activity.
Feeling Sleepy!
In Forming Connections in Displaying Categorical Data, we explored data from a study that asked college students whether they identified as owls, larks, or neither and collected other pieces of data related to academics, lifestyle, stress, and sleep. Recall that owls were defined as night people while larks represented morning people. In that activity, you used the data set from the study to visualize categorical data via pie charts and bar graphs. Now, let’s use the same data set to explore distributions of quantitative variables. In this activity, you’ll see the mean and median as numerical measures of the “center” of quantitative data.

Before we begin, consider the following question, which asks about differences between larks and owls with respect to factors contributing to quality of sleep.
question 1
video placement
[Intro: Recall using histograms to estimate mean and median as well as using technology to calculate them. Recall lark = morning person, owl = night person, and neither responses. Let’s discuss the variables of interest briefly: alcoholic drinks per week is self-explanatory. Poor sleep quality score: the higher the score, the worse the sleep quality. We want to use the tool to interpret graphs and compare centers. A highlight of the tool will be helpful]
Before we compare each of the groups (owl, lark, neither), let’s consider two variables of interest for all college students in this study:
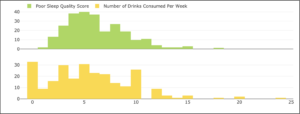
- Poor Sleep Quality Score – a score indicating the average quality of sleep for the participants; the greater the score, the worse the quality of sleep.
- Alcoholic Drinks per Week – the average number of alcoholic drinks consumed by the participants each week.
The following histograms display the frequency of the participants’ poor sleep quality scores and the number of alcoholic drinks consumed each week. Use the histograms to estimate the mean and median for each data set.