Learning Goals
In this support activity you’ll become familiar with the following:
You will also have an opportunity to refresh the following skills:
In the next section of the course material and in the following activity, you will need to understand and calculate the deviation from the mean. You will be extending this knowledge in the course section to understanding what the spread of a data set is and how it is calculated. For now, let’s concentrate on refreshing necessary skills and learning about deviation from the mean.
Deviation from the Mean
Consider the following dotplot of the exam scores for two different math classes on their midterm. The class average was [latex]70[/latex] points for both Class 1 and Class 2.
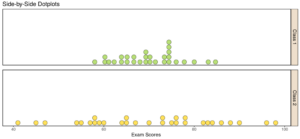
question 1
In the next activity, we will be measuring the variability of a data set. We do this by measuring the distance, known as deviation, of an observed value from the mean. Let’s look at an example from the real world.
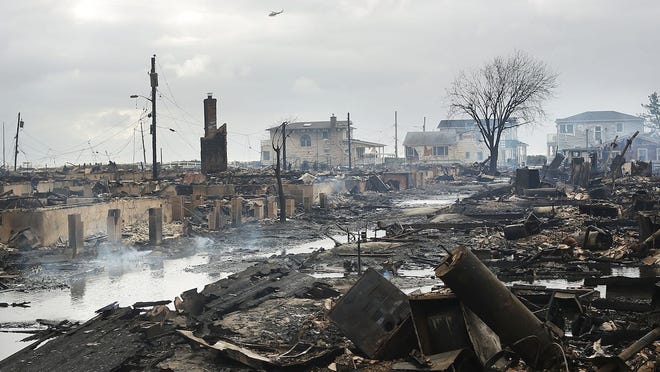
Hurricanes cause extensive amounts of damage. In this corequisite support activity, we will consider the amount of damage in dollars of the [latex]30[/latex] most expensive hurricanes to have hit the U.S. mainland between 1990 and 2010. In order to explore this data set, you will need to recall what you have learned about measures of center. We’ll concentrate on the mean of a quantitative distribution in this activity.
Mean vs. median
Before we move on, take a moment to recall the difference between mean and median.
recall
Do you recall the two measures of center you learned about in the previous section of the course: mean and median?
Core skill:
Let’s go to the technology to analyze the data set “Hurricane Damage.”
Candela Citations
- Damage shown from 2018 extreme weather season. Authored by: Spencer Platt / Getty Images. Provided by: USA Today. Located at: https://www.usatoday.com/story/money/2018/09/12/most-destructive-hurricanes-of-all-time/36697269/. License: All Rights Reserved
