Five Number Summary in Boxplots and Data Sets: Apply It 3

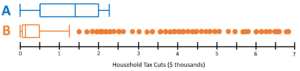
Two boxplots are provided below, each displaying a hypothetical distribution of [latex]5,000[/latex] tax cuts that would result in a mean tax cut of $[latex]1,260[/latex].

Two box plots. The horizontal axis is labeled "Household Tax Costs ($ thousands) and is numbered in increments of one. The top is labeled A and has its lowest point at zero and its highest at approximately 2.3. The lower end of the box is at approximately 0.5 while the upper end is at approximately 2. The center line is at approximately 1.4. For plot B, the lowest point is at 0 and the highest point is at approximately 1.25. The low end of the box is at approximately 0.05 while the upper end is at approximately 0.5. The middle line is at approximately 0.1. Above the high point of plot B, there are lots of individual dots very close together all the way up the rest of the box plot.

question 7

question 8