Kinematics
Concepts and Principles
An empirical fact about nature is that motion in one direction (for example, the horizontal) does not appear to influence aspects of the motion in a perpendicular direction (the vertical). Imagine a coin dropped from shoulder height. The elapsed time for the coin to hit the ground, the rate at which its vertical position is changing, and its vertical acceleration are the same whether you do this experiment in a stationary bus or one traveling down a smooth, level highway at 65 mph. The horizontal motion of the coin does not affect these aspects of its vertical motion.[1]
[1] Actually, at extremely high speeds the horizontal and vertical motions are not independent. At speeds comparable to the speed of light, the interdependence between horizontal and vertical motion (because of time dilation) becomes noticeable.
Thus, to completely describe the motion of an object moving both horizontally and vertically you can first ignore the horizontal motion, and describe only the vertical component of the motion, and then ignore the vertical motion, and describe the horizontal component. Putting these kinematic components together gives you a complete description of the motion. This experimental fact about nature will make analyzing multi-dimensional motion no more conceptually difficult than analyzing one-dimensional motion.
Given this independence between motions in perpendicular directions, the same kinematic concepts and relationships utilized in one-dimensional motion will be utilized for multi-dimensional motion.
Position
The position of an object is its location relative to a well-defined coordinate system. In multi-dimensional situations, however, you must designate coordinate systems for all perpendicular directions of interest. The zero and positive direction for one dimension is completely independent of the zero and positive direction for another direction. The location at which all coordinate system zeros intersect is referred to as the origin of the coordinate system.
Velocity
The velocity is the rate at which the position is changing. Thus, we will define the velocity component in the vertical direction, for example, as the rate at which the vertical position is changing. The velocity component in the vertical direction is completely independent of the horizontal position or the rate at which the horizontal position changes.
As long as the coordinate directions are perpendicular, the speed, or magnitude of the object’s velocity, can be determined by:

The direction of the object’s velocity can be determined via right-angle trigonometry.
Acceleration
The acceleration is the rate at which the velocity is changing. Thus, we will define the acceleration component in the vertical direction, for example, as the rate at which the velocity component in the vertical direction is changing. The acceleration component in the vertical direction is completely independent of the velocity component in the horizontal direction or the rate at which the velocity component in the horizontal direction changes.
As long as the coordinate directions are perpendicular, the magnitude of the object’s acceleration can always be determined by:
The direction of the object’s acceleration can be determined via right-angle trigonometry
Doing kinematics in multiple dimensions involves a concerted effort on your part to disregard motion in one direction when considering motion in a perpendicular direction. The ability to mentally break down a complicated motion into its component motions requires considerable practice.
Analysis Tools
Drawing Motion Diagrams
Beginning your analysis by drawing a motion diagram is always the correct first step:
In the shot put, a large mass is thrown at an angle of 22o above horizontal, from a position of 2 m above the ground, a horizontal distance of 25 m.
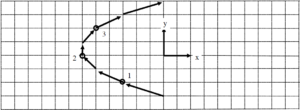
A motion diagram for this scenario is sketched below.
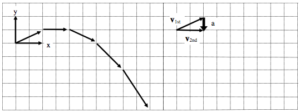
- Horizontal (x) and vertical (y) coordinate systems are clearly indicated.
- In constructing the motion diagram, only a portion of the entire motion of the shot put is illustrated. For this motion diagram, analysis begins the instant after the shot put leaves the putter’s hand, and analysis ends the instant before the shot put hits the ground. It is of extreme importance to clearly understand the beginning and the end of the motion that you will describe. The acceleration of the shot put while in the putter’s hand, and the acceleration upon contact with the ground, has been conveniently left out of this analysis. Unless explicit information is either provided or desired about these accelerations, it is best to focus analysis on the simplest portion of the motion, i.e., when it is flying freely through the air.
- The acceleration is determined by the same method as in one-dimensional motion. In this case, the acceleration was determined near the beginning of the motion. Determining the acceleration at any other time will also indicate that its direction is straight downward, since we have focused our analysis on the time interval when the shot put is being acted on by only the force of gravity.
Drawing Motion Graphs
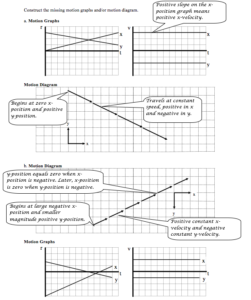
The verbal representation of the situation has already been translated into a pictorial representation, the motion diagram. A careful reading of the motion diagram allows the construction of the motion graphs.
Drawing the position vs. time graph
First, examine the position of the shot put as it moves through the air. Remember, the analysis of the horizontal position must be independent of the analysis of the vertical position.
Horizontal Position
From the motion diagram, the shot put starts at position zero, and then has positive, increasing positions throughout the remainder of its motion. The horizontal position increases by even amounts in even time intervals.

Vertical Position
The shot put starts at position zero, increases its vertical position at a rate that is decreasing, then begins to decrease its vertical position at a rate that is increasing, even as it drops to negative positions.
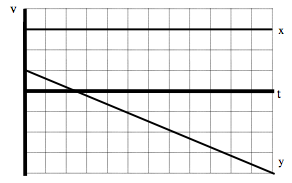
Typically, both the horizontal and vertical positions are displayed on the same axis.
Drawing the velocity vs. time graph
In the horizontal direction, the rate at which the position changes is constant. Hence, the horizontal component of velocity is constant, and positive. In the vertical direction, the velocity component begins positive, decreases to zero, and then increases in the negative direction.
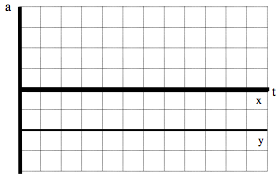
Drawing the acceleration vs. time graph
From the motion diagram, the acceleration of the shot-put can be determined to be directed downward at every point. Thus, the horizontal component of acceleration is zero and the vertical component is negative, and approximately constant due to our model’s approximations.
Tabulating Motion Information
In the shot put, a large mass is thrown at an angle of 22o above horizontal, from a position of 2 m above the ground, a horizontal distance of 25 m.
Now that you have constructed a motion diagram and motion graphs, you should be able to assign numerical values to several of the kinematic variables. A glance at the situation description should indicate that information is presented about the shot put at two distinct events: when the shot put leaves the putter’s hand and when the shot put strikes the ground. Other information can also be determined about these events by referencing the motion diagram. To organize this information, you should construct a motion table.
| Event 1: The instant after the shot put leaves the hand.
t1 = 0 s r1x = 0 m r1y = 0 m v1x = v1 cos 22° v1y = v1 sin 22° a12x = 0 m/s2 a12y = -9.8 m/s2 |
Event 2: The instant before the shot put hits the ground.
t2 = r2x = +25 m r2y = -2 m v2x = v2y = |
In addition to the information explicitly given (the initial and final positions), information is available about both the initial velocity and the acceleration.
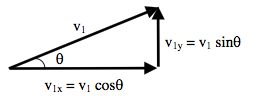
- Initial velocity: Although the magnitude of the initial velocity (v1) is unknown, its orientation in space is known. Thus, via the right-angle trigonometry shown below, the components of this unknown magnitude velocity in the horizontal and vertical directions can be determined. Since we will analyze the x- and y-motion separately, we must break the initial velocity into its x- and y-components.
- Acceleration: The only force acting on the shot-put during the time interval of interest is the force of gravity, which acts directly downward. This is because the analysis of the motion is restricted to the time interval after leaving the thrower’s hand and before striking the ground. Thus, there is no horizontal acceleration of the shot-put and the vertical acceleration has a magnitude of 9.8 m/s2.
Doing the Math
In Model 1, you were presented with two kinematic relationships. These relationships are valid in both the horizontal and vertical directions. Thus, you have a total of four relationships with which to analyze the scenario given. In the example above, there are four unknown kinematic variables. You should remember from algebra that four equations are sufficient to calculate four unknowns. Thus, by applying the kinematic relations in both the horizontal and vertical directions, you should be able to determine the initial velocity of the shot-put, the time in the air, and the final horizontal and vertical velocity components.
First, let’s examine the horizontal component of the motion. Note that the positions, velocities, and accelerations in the following equations are all horizontal components.
x-direction
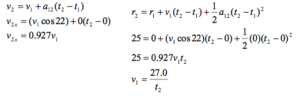
Now let’s examine the vertical component of the motion. All the positions, velocities, and accelerations in the following equations are now vertical components.
y-direction
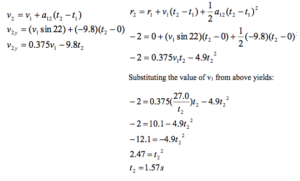
Plugging t2 = 1.57 s into all of the remaining equations gives:
v1 = 17.2 m/s v2x = 15.9 m/s v2y = -8.94 m/s
Hints and Suggestions
Selecting Events
Let’s look again at the shot-putter.
In the shot put, a large mass is thrown at an angle of 22o above horizontal, from a position of 2 m above the ground, a horizontal distance of 25 m.
Imagine a video of the shot put event. Fast-forward over the frames showing the shot putter picking up the shot and stepping into the ring. Begin to watch the imaginary video frame-by-frame as the shot putter begins to push the shot off of her shoulder and forward. Stop the video on the frame when the shot first leaves the putter’s hand.
Why is it so important that we begin the analysis at this frame and explicitly disregard all the motion that has taken place before this frame? The reason is that in every frame preceding this frame, the shot put was in contact with the putter. Thus, the putter was exerting a force on the shot. Since no information is presented concerning this force, we have no way to determine the acceleration during these frames and hence no way to determine any other kinematic variables. Thus, we disregard all motion preceding the instant the shot leaves the putter’s hand because that portion of the motion is simply impossible to analyze with the information provided. Once the shot leaves her hand, the only force acting on the shot is the force of gravity, which greatly simplifies the analysis.
Continue playing the imaginary video forward. Begin playing the tape frame-by-frame as the shot approaches the ground. Stop the video the frame before the shot hits the ground. We will stop our analysis at this frame. Why? Because starting with the next frame, the shot is in contact with the ground. Once in contact with the ground, an additional, unknown magnitude force begins to act on the shot. Once an unknown magnitude force begins to act, the acceleration of the shot becomes unknown and we are stuck. Thus, we conveniently stop our analysis before things get too complicated!
Since our analysis stops the instant before contact, note that the shot is still moving at this instant. (If it wasn’t, how could it ever reach the ground?) Thus, resist the temptation to think that the velocity of the shot is zero at the end of analysis. The velocity of the shot is ultimately equal to zero (after it makes a big divot into the ground) but that happens long after it strikes the ground and hence long after our analysis is finished.
Activities
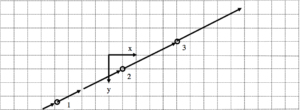
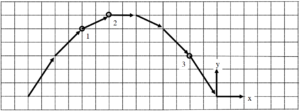
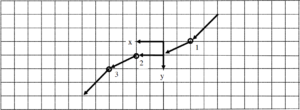
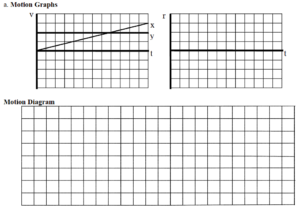
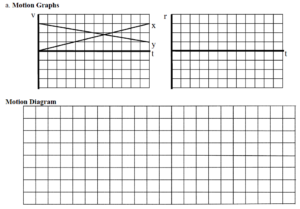
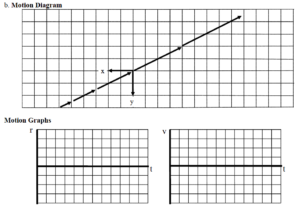
For each of the motion diagrams below, determine the algebraic sign (+, – or zero) of the x- and y-position, velocity, and acceleration of the object at location of the three open circles.
a.
b.
c.
d.
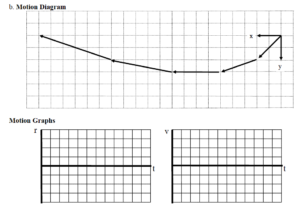
Construct the missing motion graphs and/or motion diagram.
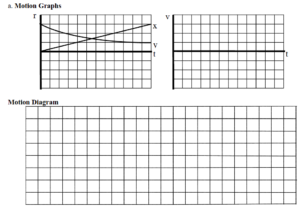

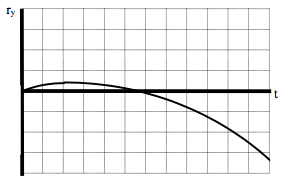
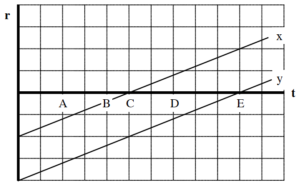
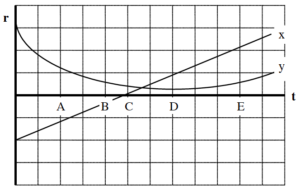
An object’s motion is represented by the position vs. time graph below. Both the x- and y-position components are indicated on the graph.
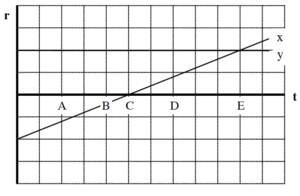
a. Rank the object’s distance from the origin at the lettered times.
Largest 1. E 2. A 3. D 4. B 5. C Smallest
_____ The ranking cannot be determined based on the information provided.
Since distance is given by Pythagoras’ Theorem, ![]() , and ry is constant, the distance from the origin is proportional to the magnitude of the x-position.
, and ry is constant, the distance from the origin is proportional to the magnitude of the x-position.
b. Rank the object’s speed at the lettered times.
Largest 1. ABCDE 2. 3. 4. 5. Smallest
_____ The ranking cannot be determined based on the information provided.
The object moves with constant speed in the positive x-direction.
c. Rank the angle between the object’s velocity and the x-axis at the lettered times, measuring all angles counterclockwise from +x. (Thus, the +y axis is at 900.)
Largest 1. ABCDE 2. 3. 4. 5. Smallest
_____ The ranking cannot be determined based on the information provided.
Since the object moves with constant speed in the positive x-direction, the angle of its velocity vector is 0°
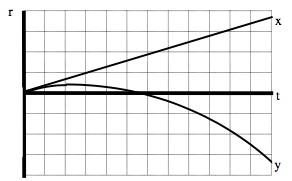
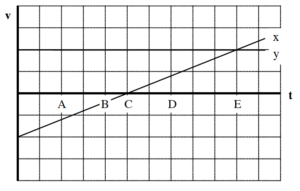
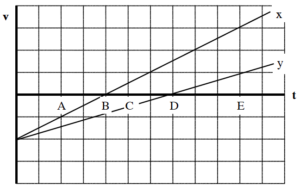
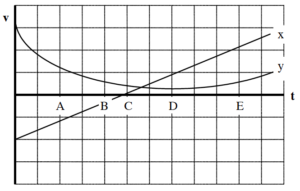
An object’s motion is represented by the velocity vs. time graph below. Both the x- and y-velocity components are indicated on the graph.
a. Rank the object’s distance from the origin at the lettered times.
Largest 1. 2. 3. 4. 5. Smallest
__X__ The ranking cannot be determined based on the information provided.
Since a velocity graph doesn’t specify the location of the coordinate system, you can’t determine the distance from the origin of the coordinate system.
b. Rank the object’s speed at the lettered times.
Largest 1. E 2. A 3. D 4. B 5. C Smallest
_____ The ranking cannot be determined based on the information provided.
Since speed is given by ![]() , and vy is constant, the speed is proportional to the magnitude of the x-position velocity.
, and vy is constant, the speed is proportional to the magnitude of the x-position velocity.
c. Rank the angle between the object’s velocity and the x-axis at the lettered times, measuring all angles counterclockwise from +x. (Thus, the +y axis is at 900.)
Largest 1. A 2. B 3. C 4. D 5. E Smallest
_____ The ranking cannot be determined based on the information provided.
Draw a motion diagram! The y-velocity is constant and positive, so all of the vectors are in the first and second quadrant. A and B are at > 90°, C is at 90°, and D and E are at < 90°.
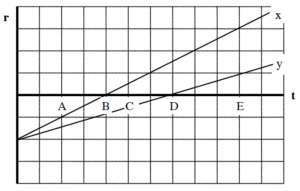
An object’s motion is represented by the position vs. time graph below. Both the x- and y-position components are indicated on the graph.
Rank the object’s distance from the origin at the lettered times.
Largest 1. _____ 2. _____ 3. _____ 4. _____ 5. _____ Smallest
_____ The ranking cannot be determined based on the information provided.
Rank the object’s speed at the lettered times.
Largest 1. _____ 2. _____ 3. _____ 4. _____ 5. _____ Smallest
_____ The ranking cannot be determined based on the information provided.
Rank the angle between the object’s velocity and the x-axis at the lettered times, measuring all angles counterclockwise from +x. (Thus, the +y axis is at 900.)
Largest 1. _____ 2. _____ 3. _____ 4. _____ 5. _____ Smallest
_____ The ranking cannot be determined based on the information provided.
An object’s motion is represented by the velocity vs. time graph below. Both the x- and y-velocity components are indicated on the graph.
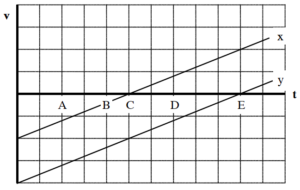
Rank the object’s distance from the origin at the lettered times.
Largest 1. _____ 2. _____ 3. _____ 4. _____ 5. _____ Smallest
_____ The ranking cannot be determined based on the information provided.
Rank the object’s speed at the lettered times.
Largest 1. _____ 2. _____ 3. _____ 4. _____ 5. _____ Smallest
_____ The ranking cannot be determined based on the information provided.
Rank the angle between the object’s velocity and the x-axis at the lettered times, measuring all angles counterclockwise from +x. (Thus, the +y axis is at 900.)
Largest 1. _____ 2. _____ 3. _____ 4. _____ 5. _____ Smallest
_____ The ranking cannot be determined based on the information provided.
An object’s motion is represented by the position vs. time graph below. Both the x- and y-position components are indicated on the graph.
Rank the object’s distance from the origin at the lettered times.
Largest 1. _____ 2. _____ 3. _____ 4. _____ 5. _____ Smallest
_____ The ranking cannot be determined based on the information provided.
Rank the object’s speed at the lettered times.
Largest 1. _____ 2. _____ 3. _____ 4. _____ 5. _____ Smallest
_____ The ranking cannot be determined based on the information provided.
Rank the angle between the object’s velocity and the x-axis at the lettered times, measuring all angles counterclockwise from +x. (Thus, the +y axis is at 900.)
Largest 1. _____ 2. _____ 3. _____ 4. _____ 5. _____ Smallest
_____ The ranking cannot be determined based on the information provided.
An object’s motion is represented by the velocity vs. time graph below. Both the x- and y-velocity components are indicated on the graph.
Rank the object’s distance from the origin at the lettered times.
Largest 1. _____ 2. _____ 3. _____ 4. _____ 5. _____ Smallest
_____ The ranking cannot be determined based on the information provided.
Rank the object’s speed at the lettered times.
Largest 1. _____ 2. _____ 3. _____ 4. _____ 5. _____ Smallest
_____ The ranking cannot be determined based on the information provided.
Rank the angle between the object’s velocity and the x-axis at the lettered times, measuring all angles counterclockwise from +x. (Thus, the +y axis is at 900.)
Largest 1. _____ 2. _____ 3. _____ 4. _____ 5. _____ Smallest
_____ The ranking cannot be determined based on the information provided.
Below are six identical baseballs thrown horizontally at different speeds from different heights above the ground. Assume the effects of air resistance are negligible.
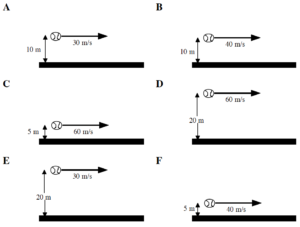
Rank these baseballs on the basis of the elapsed time before they hit the ground.
Largest 1. _____ 2. _____ 3. _____ 4. _____ 5. _____ 6. _____ Smallest
_____ The ranking cannot be determined based on the information provided.
Explain the reason for your ranking.
Rank these baseballs on the basis of the magnitude of their vertical velocity when they hit the ground.
Largest 1. _____ 2. _____ 3. _____ 4. _____ 5. _____ 6. _____ Smallest
_____ The ranking cannot be determined based on the information provided.
Explain the reason for your ranking.
Below are six balls of different mass thrown horizontally at different speeds from the same height above the ground. Assume the effects of air resistance are negligible.
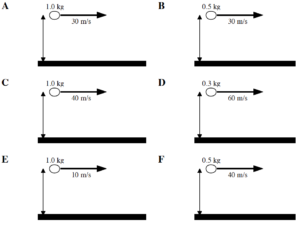
Rank these baseballs on the basis of the elapsed time before they hit the ground.
Largest 1. _____ 2. _____ 3. _____ 4. _____ 5. _____ 6. _____ Smallest
_____ The ranking cannot be determined based on the information provided.
Explain the reason for your ranking.
Rank these baseballs on the basis of the horizontal distance traveled before they hit the ground.
Largest 1. _____ 2. _____ 3. _____ 4. _____ 5. _____ 6. _____ Smallest
_____ The ranking cannot be determined based on the information provided.
Explain the reason for your ranking.
Below are six different directions and speeds at which a baseball can be thrown. In all cases the baseball is thrown at the same height, H, above the ground. Assume the effects of air resistance are negligible.
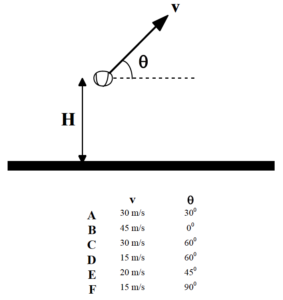
Rank these baseballs on the basis of the maximum height the baseball reaches above the ground.
Largest 1. _____ 2. _____ 3. _____ 4. _____ 5. _____ 6. _____ Smallest
_____ The ranking cannot be determined based on the information provided.
Explain the reason for your ranking.
Rank these baseballs on the basis of the elapsed time before they hit the ground.
Largest 1. _____ 2. _____ 3. _____ 4. _____ 5. _____ 6. _____ Smallest
_____ The ranking cannot be determined based on the information provided.
Explain the reason for your ranking.
At a circus, a human cannonball is shot from a cannon at 15 m/s at an angle of 400 above horizontal. She leaves the cannon 1.0 m off the ground and lands in a net 2.0 m off the ground.
Motion Diagram
Motion Information
| Event 1:
t1 = r1x = r1y = v1x = v1y = a12x = a12y = |
Event 2:
t2 = r2x = r2y = v2x = v2y = |
Mathematical Analysis[i]
x-direction y-direction
At the buzzer, a basketball player shoots a desperation shot. She is 10 m from the basket and the ball leaves her hands exactly 1.2 m below the rim. She shoots at 350 above the horizontal and the ball goes in!
Motion Diagram
Motion Information
| Event 1:
t1 = r1x = r1y = v1x = v1y = a12x = a12y = |
Event 2:
t2 = r2x = r2y = v2x = v2y = |
Mathematical Analysis[ii]
x-direction y-direction
With 1.0 s left on the clock, a basketball player shoots a desperation shot. The ball leaves her hands exactly 0.9 m below the rim at an angle of 350 above the horizontal and the ball goes in just as the buzzer sounds!
Motion Diagram
Motion Information
| Event 1:
t1 = r1x = r1y = v1x = v1y = a12x = a12y = |
Event 2:
t2 = r2x = r2y = v2x = v2y = |
Mathematical Analysis[iii]
x-direction y-direction
A mountaineer must leap across a 3.0 m wide crevasse. The other side of the crevasse is 4.0 m below the point from which the mountaineer leaps. The mountaineer leaps at 350 above horizontal and successfully makes the jump.
Motion Diagram
Motion Information
| Event 1:
t1 = r1x = r1y = v1x = v1y = a12x = a12y = |
Event 2:
t2 = r2x = r2y = v2x = v2y = |
Mathematical Analysis[iv]
x-direction y-direction
The right fielder flawlessly fields the baseball and throws a perfect strike to the catcher who tags out the base runner trying to score. The right fielder is approximately 300 feet (90 m) from home plate and throws the ball at an initial angle of 30° above horizontal. The catcher catches the ball on the fly exactly 1.7 m below the height from which it was thrown.
Motion Diagram
Motion Information
| Event 1:
t1 = r1x = r1y = v1x = v1y = a12x = a12y = |
Event 2:
t2 = r2x = r2y = v2x = v2y = |
Mathematical Analysis[v]
x-direction y-direction
The right fielder flawlessly fields the baseball and throws the ball at 94 mph (42 m/s) at an initial angle of 20° above horizontal toward home plate. The fielder is 80 m from the catcher and the ball leaves his hand exactly 1.6 m above the ground.
Motion Diagram
| Event 1:
t1 = r1x = r1y = v1x = v1y = a12x = a12y = |
Event 2:
t2 = r2x = r2y = v2x = v2y = |
Mathematical Analysis[vi]
x-direction y-direction
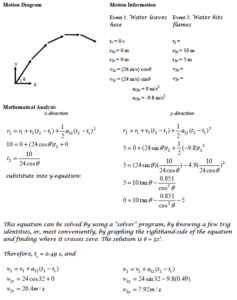
A fire hose, with muzzle velocity of 24 m/s, is used to put out an apartment building fire. The fire is raging inside an apartment 5.0 m above the level of the hose and 10 m, measured horizontally, from the end of the hose. Ignore the effects of air resistance on the water.
A mountaineer must leap across a 3.0 m wide crevasse. The other side of the crevasse is 4.0 m below the point from which the mountaineer leaps. The mountaineer leaps at a speed of 3.5 m/s and barely makes the jump.
Motion Diagram
Motion Information
| Event 1:
t1 = r1x = r1y = v1x = v1y = a12x = a12y = |
Event 2:
t2 = r2x = r2y = v2x = v2y = |
Mathematical Analysis[vii]
x-direction y-direction
The right fielder flawlessly fields the baseball and must throw a perfect strike to the catcher, 90 m away, to tag out the base runner trying to score. The right fielder knows she can throw a baseball at 80 mph (36 m/s) and calculates the proper angle at which to throw so that the catcher will catch the ball on the fly exactly 1.8 m below the height from which it was thrown. However, her calculation is so time-consuming that the ball arrives too late and the runner scores.
Motion Diagram
Motion Information
| Event 1:
t1 = r1x = r1y = v1x = v1y = a12x = a12y = |
Event 2:
t2 = r2x = r2y = v2x = v2y = |
Mathematical Analysis[viii]
x-direction y-direction
At the buzzer, a basketball player shoots a desperation shot. She is 14 m from the basket and the ball leaves her hands exactly 1.4 m below the rim. She throws the ball at 18 m/s. Can she make the shot?
Motion Diagram
Motion Information
| Event 1:
t1 = r1x = r1y = v1x = v1y = a12x = a12y = |
Event 2:
t2 = r2x = r2y = v2x = v2y = |
Mathematical Analysis[ix]
x-direction y-direction
At a circus, a human cannonball will be shot from a cannon at 15 m/s. She will leave the cannon 1.0 m off the ground and hopefully land in a net 3.0 m off the ground, after flying a horizontal distance of 22 m. Do you want this job?
Motion Diagram
Motion Information
| Event 1:
t1 = r1x = r1y = v1x = v1y = a12x = a12y = |
Event 2:
t2 = r2x = r2y = v2x = v2y = |
Mathematical Analysis[x]
x-direction y-direction
At a circus, a human cannonball will be shot from a cannon at 24 m/s. She will leave the cannon 1.0 m off the ground and hopefully land in a net 3.0 m off the ground, after flying a horizontal distance of 22 m. Do you want this job?
Motion Diagram
Motion Information
| Event 1:
t1 = r1x = r1y = v1x = v1y = a12x = a12y = |
Event 2:
t2 = r2x = r2y = v2x = v2y = |
Mathematical Analysis[xi]
x-direction y-direction
A ball is rolled off a level 0.80 m high table at 15 m/s. The floor beyond the table slopes down at a constant 50 below the horizontal.
Motion Diagram
Motion Information
| Event 1:
t1 = r1x = r1y = v1x = v1y = a12x = a12y = |
Event 2:
t2 = r2x = r2y = v2x = v2y = |
Mathematical Analysis[xii]
x-direction y-direction
A golf ball leaves the club at 18 m/s at an angle of 650 above the horizontal. The ground ahead slopes upward at 4°.
Motion Diagram
Motion Information
| Event 1:
t1 = r1x = r1y = v1x = v1y = a12x = a12y = |
Event 2:
t2 = r2x = r2y = v2x = v2y = |
Mathematical Analysis[xiii]
x-direction y-direction
A ski-jumper leaves the ramp at an angle of 110 above the horizontal, 3.0 m above the ground. The ground slopes downward at 33° from this point. The jumper lands 140 m down the slope.
Motion Diagram
Motion Information
| Event 1:
t1 = r1x = r1y = v1x = v1y = a12x = a12y = |
Event 2:
t2 = r2x = r2y = v2x = v2y = |
Mathematical Analysis[xiv]
x-direction y-direction
A kayaker 120 m east and 350 m north of his campsite is moving with the current at 2 m/s to the south. He begins to paddle west, giving the kayak an acceleration of 0.2 m/s2 for 15 s.
Motion Diagram
Motion Information
| Event 1:
t1 = r1x = r1y = v1x = v1y = a12x = a12y = |
Event 2:
t2 = r2x = r2y = v2x = v2y = |
Mathematical Analysis[xv]
x-direction y-direction
A kayaker 120 m east and 80 m north of her campsite is moving with the current at 2 m/s to the south. She begins to paddle west, giving the kayak a constant acceleration. She lands right at her campsite.
Motion Diagram
Motion Information
| Event 1:
t1 = r1x = r1y = v1x = v1y = a12x = a12y = |
Event 2:
t2 = r2x = r2y = v2x = v2y = |
Mathematical Analysis[xvi]
x-direction y-direction
An astronaut on a spacewalk is 30 m from her spaceship and moving at 0.8 m/s away from her ship, at an angle of 17° from a line between her and the ship. She engages her Manned Maneuvering Unit (MMU) for 15 s. The MMU imparts an acceleration of 0.1 m/s2 to her in the direction she was originally moving.
Motion Diagram
Motion Information
| Event 1:
t1 = r1x = r1y = v1x = v1y = a12x = a12y = |
Event 2:
t2 = r2x = r2y = v2x = v2y = |
Mathematical Analysis[xvii]
x-direction y-direction
An astronaut on a spacewalk is 30 m from her spaceship and moving at 0.8 m/s away from her ship, at an angle of 17° from a line between her and the ship. She engages her Manned Maneuvering Unit (MMU) for 20 s. The MMU imparts an acceleration of 0.1 m/s2 to her in the direction initially toward her ship. (She does not change this direction during the maneuver.)
Motion Diagram
Motion Information
| Event 1:
t1 = r1x = r1y = v1x = v1y = a12x = a12y = |
Event 2:
t2 = r2x = r2y = v2x = v2y = |
Mathematical Analysis[xviii]
x-direction y-direction
An astronaut on a spacewalk is 30 m from his spaceship and moving at 0.8 m/s away from his ship, at an angle of 17° from a line between him and the ship. He engages his Manned Maneuvering Unit (MMU), which supplies an acceleration of 0.1 m/s2 in a constant direction. He returns to his ship safely.
Motion Diagram
Motion Information
| Event 1:
t1 = r1x = r1y = v1x = v1y = a12x = a12y = |
Event 2:
t2 = r2x = r2y = v2x = v2y = |
Mathematical Analysis[xix]
x-direction y-direction
Determine the time-of-flight (T) of a rock thrown horizontally off of a cliff as a function of the initial velocity (vi), the height of the cliff (H), and g. Assume the ground at the base of the cliff is level.
Motion Diagram
Motion Information
| Event 1:
t1 = r1x = r1y = v1x = v1y = a12x = a12y = |
Event 2:
t2 = r2x = r2y = v2x = v2y = |
Mathematical Analysis
x-direction y-direction
Questions
If H = ∞, what should T equal? Does your function agree with this observation?
If g = 0 m/s2, what should T equal? Does your function agree with this observation?
If vi is doubled, what happens to T?
Determine the horizontal range (R) of a rock thrown horizontally off of a cliff as a function of the initial velocity (vi), the height of the cliff (H), and g. Assume the ground at the base of the cliff is level.
Motion Diagram
Motion Information
| Event 1:
t1 = r1x = r1y = v1x = v1y = a12x = a12y = |
Event 2:
t2 = r2x = r2y = v2x = v2y = |
Mathematical Analysis
x-direction y-direction
Questions
If H = ∞, what should R equal? Does your function agree with this observation?
If g = ∞, what should R equal? Does your function agree with this observation?
If vi is doubled, what happens to R?
Determine the maximum height (H) of a projectile launched over level ground as a function of the initial velocity (vi), the launch angle (q), and g.
Motion Diagram
Motion Information
| Event 1:
t1 = r1x = r1y = v1x = v1y = a12x = a12y = |
Event 2:
t2 = r2x = r2y = v2x = v2y = |
Mathematical Analysis
x-direction y-direction
Questions
If g = ∞, what should H equal? Does your function agree with this observation?
If q = 0°, what should H equal? Does your function agree with this observation?
If vi is doubled, what happens to H?
Determine the range (R) of a projectile launched over level ground as a function of the initial velocity (vi), the launch angle (q), and g.
Motion Diagram
Motion Information
| Event 1:
t1 = r1x = r1y = v1x = v1y = a12x = a12y = |
Event 2:
t2 = r2x = r2y = v2x = v2y = |
Mathematical Analysis
x-direction y-direction
Questions
If g = 0 m/s2, what should R equal? Does your function agree with this observation?
If q = 90°, what should R equal? Does your function agree with this observation?
If vi is doubled, what happens to R?
A projectile is launched from the top of an decline of constant angle f.Determine the distance the projectile travels along the decline (D) as a function of the initial velocity (vi), the launch angle above horizontal (q), the decline angle (f), and g.
Motion Diagram
Motion Information
| Event 1:
t1 = r1x = r1y = v1x = v1y = a12x = a12y = |
Event 2:
t2 = r2x = r2y = v2x = v2y = |
Mathematical Analysis
x-direction y-direction
Questions
If f = 90°, what should D equal? Does your function agree with this observation?
If q = 90°, what should D equal? Does your function agree with this observation?
[i] t2 = 1.86 s
[ii] v1 = 11.2 m/s
[iii] Drx = 8.3 m
[iv] v1 = 3.28 m/s
[v] v1 = 31.4 m/s
[vi] The ball hits people in the stands behind home plate. (It sails 10.7 m above home plate.)
[vii] q = 44°
[viii] q = 20.1°, 68.8°
[ix] q = 18.6°, 77.2°
[x] No.
[xi] Yes, as long as the cannon is set to 16.4°.
[xii] t2 = 0.56 s
[xiii] t2 = 3.22 s
[xiv] t2 = 3.22 s
[xv] 335 m from home
[xvi] t2 = 40 s a = 0.15 m/s2
[xvii] 52.6 m from ship
[xviii] 25.7 m from ship
[xix] t2 = 33.5 s q = 188° from line initially between ship and man
http://www.compadre.org/IVV/vignettes/projectileMotion.cfm
Homework 4 – Model 2: 14, 18, 22, 23, 28, 31, 34, 42, 45, and 53.
Candela Citations
- University Physics I Homework Assignments. Authored by: Mary Mohr. License: CC BY-NC-SA: Attribution-NonCommercial-ShareAlike