
Shift in Demand Due to Income Increase
A shift in demand means that at any price (and at every price), the quantity demanded will be different than it was before. Following is a graphic illustration of a shift in demand due to an income increase.
Step 1. Draw the graph of a demand curve for a normal good like pizza. Pick a price (like P0). Identify the corresponding Q0. An example is shown in Figure 1.
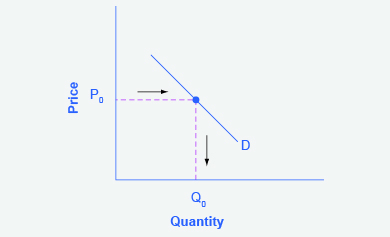
Figure 1. Demand Curve. A demand curve can be used to identify how much consumers would buy at any given price.
Step 2. Suppose income increases. As a result of the change, are consumers going to buy more or less pizza? The answer is more. Draw a dotted horizontal line from the chosen price, through the original quantity demanded, to the new point with the new Q1. Draw a dotted vertical line down to the horizontal axis and label the new Q1. An example is provided in Figure 2.
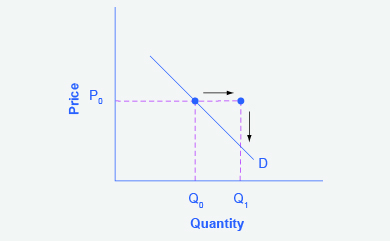
Figure 2. Demand Curve with Income Increase. With an increase in income, consumers will purchase larger quantities, pushing demand to the right.
Step 3. Now, shift the curve through the new point. You will see that an increase in income causes an upward (or rightward) shift in the demand curve, so that at any price, the quantities demanded will be higher, as shown in Figure 3.
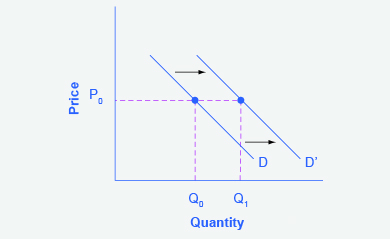
Figure 3. Demand Curve Shifted Right. With an increase in income, consumers will purchase larger quantities, pushing demand to the right, and causing the demand curve to shift right.
Candela Citations
- Revision and adaptation. Provided by: Lumen Learning. License: CC BY: Attribution
- Principles of Microeconomics Chapter 3.2. Authored by: OpenStax College. Provided by: Rice University. Located at: http://cnx.org/contents/ea2f225e-6063-41ca-bcd8-36482e15ef65@10.31:24/Microeconomics. License: CC BY: Attribution
- Is anyone interested in a pizza party?. Authored by: mikethefifth. Located at: https://www.flickr.com/photos/20608722@N00/13280037445/. License: CC BY-NC-ND: Attribution-NonCommercial-NoDerivatives