In the beginning of this module, we presented the Gini coefficient, also called the Gini Index. The Gini coefficient is the ratio of how far an economy departs from equal distribution of wealth to a perfectly equal distribution of wealth, as shown in the graph below.
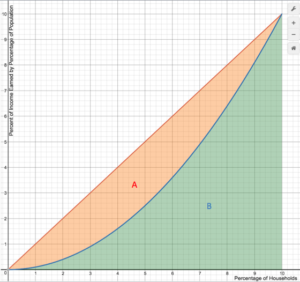
Gini Index
It’s great to have a tool to describe an issue like income inequality that ripples through social, economic, and political realms so pervasively. But, some may argue, the real power of the tool is how it is used to instruct those who make decisions that affect the ever widening rift between the top 1% and the rest of us. According to Andrew Fieldhouse, blogger for the Economic Policy Institute,
“Changes in tax and transfer policies are one of the more easily quantifiable contributors to income inequality, say compared with policies (or lack thereof) related to labor protections, collective bargaining, minimum wage erosion and trade.”[1]
He states that market-based income inequality, as measured by the “Gini” index, rose 23.1 percent between 1979 and 2007. Fieldhouse argues that by raising top tax rates, policy makers could help to slow the growth of income inequality without hampering growth of the economy. He also claims that tax policy lacks what could be valuable guidance from economic indicators such as the Gini Index. Using mathematics to inform policies also has the added benefit of being politically neutral. Math does not care what side of the aisle the policy may be coming from. When used wisely, mathematical facts offer an objective picture.
- "How Much Can Tax Policy Curb Income Inequality Growth? Maybe a Lot." Economic Policy Institute. Accessed June 29, 2016. http://www.epi.org/blog/tax-policy-curb-income-inequality-growth/. ↵