Learning Outcomes
- Plot Ordered Pairs
- Identify the components of the coordinate plane
- Plot ordered pairs on the coordinate plane
- Identify Quadrants on the Coordinate Plane
- Identify the four quadrants of a coordinate plane
- Given an ordered pair, determine its quadrant
The coordinate plane was developed centuries ago (in 1637, to be exact) and refined by the French mathematician René Descartes. In his honor, the system is sometimes called the Cartesian coordinate system. The coordinate plane can be used to plot points and graph lines. This system allows us to describe algebraic relationships in a visual sense, and also helps us create and interpret algebraic concepts.
The Components of the Coordinate Plane
You have likely used a coordinate plane before. For example, have you ever used a gridded overlay to map the position of an object? (This is often done with road maps, too.)
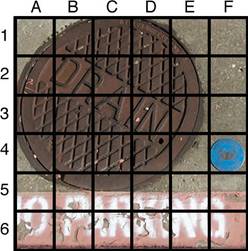
This “map” uses a horizontal and vertical grid to convey information about an object’s location. Notice that the letters A–F are listed along the top, and the numbers 1–6 are listed along the left edge. The general location of any item on this map can be found by using the letter and number of its grid square. For example, you can find the item that exists at square “4F” by moving your finger along the horizontal to letter F and then straight down so you are in line with the 4. You’ll find a blue disc is at this location on the map.
The coordinate plane has similar elements to the grid shown above. It consists of a horizontal axis and a vertical axis, number lines that intersect at right angles. (They are perpendicular to each other.)
The horizontal axis in the coordinate plane is called the x-axis. The vertical axis is called the y-axis. The point at which the two axes intersect is called the origin. The origin is at 0 on the x-axis and 0 on the y-axis.
Locations on the coordinate plane are described as ordered pairs. An ordered pair tells you the location of a point by relating the point’s location along the x-axis (the first value of the ordered pair) and along the y-axis (the second value of the ordered pair).
In an ordered pair, such as (x, y), the first value is called the x-coordinate and the second value is the y-coordinate. Note that the x-coordinate is listed before the y-coordinate. Since the origin has an x-coordinate of 0 and a y-coordinate of 0, its ordered pair is written (0, 0).
Consider the point below.
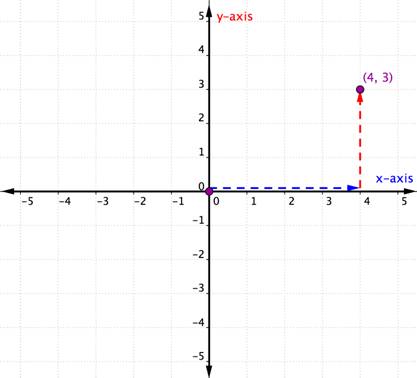
To identify the location of this point, start at the origin (0, 0) and move right along the x-axis until you are under the point. Look at the label on the x-axis. The 4 indicates that, from the origin, you have traveled four units to the right along the x-axis. This is the x-coordinate, the first number in the ordered pair.
From 4 on the x-axis move up to the point and notice the number with which it aligns on the y-axis. The 3 indicates that, after leaving the x-axis, you traveled 3 units up in the vertical direction, the direction of the y-axis. This number is the y-coordinate, the second number in the ordered pair. With an x-coordinate of 4 and a y-coordinate of 3, you have the ordered pair (4, 3).
Let’s look at another example.
Example
Describe the point shown as an ordered pair.
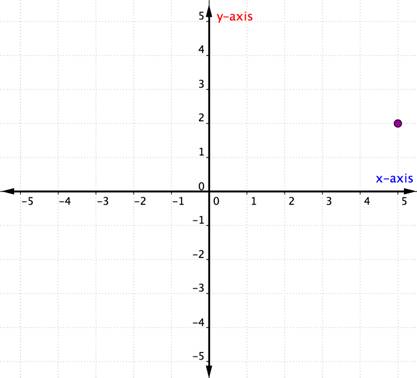
Describe the point shown as an ordered pair
Plotting Points in the Coordinate Plane
Now that you know how to use the x- and y-axes, you can plot an ordered pair as well. Just remember, both processes start at the origin—the beginning! The example that follows shows how to graph the ordered pair (1,3).
Example
Plot the point (1, 3).

In the previous example, both the x- and y-coordinates were positive. When one (or both) of the coordinates of an ordered pair is negative, you will need to move in the negative direction along one or both axes. Consider the example below in which both coordinates are negative.
Example
Plot the point [latex](−4,−2)[/latex].
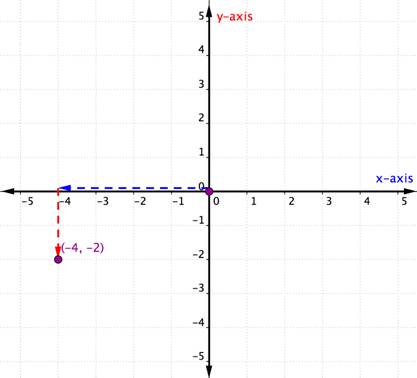
The x-coordinate is [latex]−4[/latex] because it comes first in the ordered pair. Start at the origin and move 4 units in a negative direction (left) along the x-axis.
The y-coordinate is [latex]−2[/latex] because it comes second in the ordered pair. Now move 2 units in a negative direction (down). If you look over to the y-axis, you should be lined up with [latex]−2[/latex] on that axis.
The steps for plotting a point are summarized below.
Steps for Plotting an Ordered Pair (x, y) in the Coordinate Plane
- Determine the x-coordinate. Beginning at the origin, move horizontally, the direction of the x-axis, the distance given by the x-coordinate. If the x-coordinate is positive, move to the right; if the x-coordinate is negative, move to the left.
- Determine the y-coordinate. Beginning at the x-coordinate, move vertically, the direction of the y-axis, the distance given by the y-coordinate. If the y-coordinate is positive, move up; if the y-coordinate is negative, move down.
- Draw a point at the ending location. Label the point with the ordered pair.
Plotting Points on the Coordinate Plane
Identify quadrants and use them to plot points
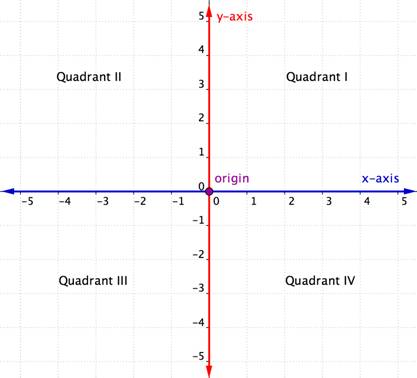
The intersecting x- and y-axes of the coordinate plane divide it into four sections. These four sections are called quadrants. Quadrants are named using the Roman numerals I, II, III, and IV beginning with the top right quadrant and moving counter clockwise.
Ordered pairs within any particular quadrant share certain characteristics. Look at each quadrant in the graph below. What do you notice about the signs of the x- and y-coordinates of the points within each quadrant?
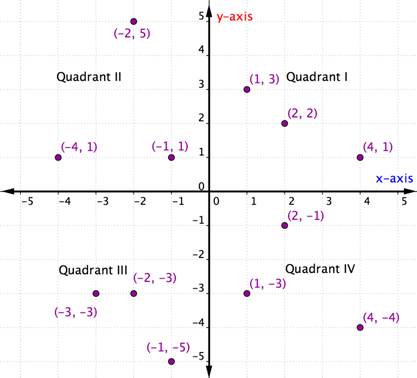
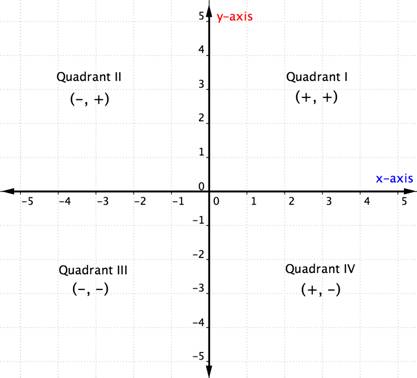
Within each quadrant, the signs of the x-coordinates and y-coordinates of each ordered pair are the same. They also follow a pattern, which is outlined in the table below.
| Quadrant | General Form of Point in this Quadrant | Example | Description |
|---|---|---|---|
| I | [latex](+,+)[/latex] | [latex](5,4)[/latex] | Starting from the origin, go along the x-axis in a positive direction (right) and along the y-axis in a positive direction (up). |
| II | [latex](−,+)[/latex] | [latex](−5,4)[/latex] | Starting from the origin, go along the x-axis in a negative direction (left) and along the y-axis in a positive direction (up). |
| III | [latex](−,−)[/latex] | [latex](−5,−4)[/latex] | Starting from the origin, go along the x-axis in a negative direction (left) and along the y-axis in a negative direction (down). |
| IV | [latex](+,−)[/latex] | [latex](5,−4)[/latex] | Starting from the origin, go along the x-axis in a positive direction (right) and along the y-axis in a negative direction (down). |
Once you know about the quadrants in the coordinate plane, you can determine the quadrant of an ordered pair without even graphing it by looking at the chart above. Here’s another way to think about it.
The example below details how to determine the quadrant location of a point just by thinking about the signs of its coordinates. Thinking about the quadrant location before plotting a point can help you prevent a mistake. It is also useful knowledge for checking that you have plotted a point correctly.
Example
In which quadrant is the point [latex](−7,10)[/latex] located?
Example
In which quadrant is the point [latex](−10,−5)[/latex] located?
What happens if an ordered pair has an x– or y-coordinate of zero? The example below shows the graph of the ordered pair [latex](0,4)[/latex].
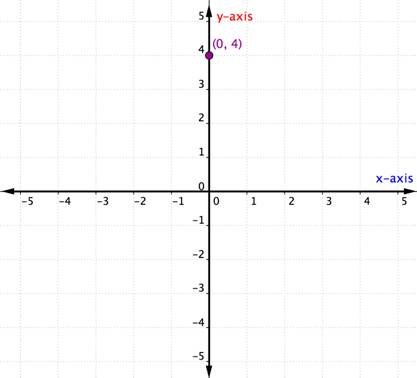
A point located on one of the axes is not considered to be in a quadrant. It is simply on one of the axes. Whenever the x-coordinate is 0, the point is located on the y-axis. Similarly, any point that has a y-coordinate of 0 will be located on the x-axis.
Identify quadrants and use them to plot points
Summary
The coordinate plane is a system for graphing and describing points and lines. The coordinate plane is comprised of a horizontal (x-) axis and a vertical (y-) axis. The intersection of these lines creates the origin, which is the point [latex](0,0)[/latex]. The coordinate plane is split into four quadrants. Together, these features of the coordinate system allow for the graphical representation and communication about points, lines, and other algebraic concepts.
Candela Citations
- Revision and Adaptation. Provided by: Lumen Learning. License: Public Domain: No Known Copyright
- Determine the Ordered Pairs for Points Plotted on the Coordinate Plane. Authored by: James Sousa (Mathispower4u.com) . Located at: https://youtu.be/c9WVU34MY5Q. License: CC BY: Attribution
- Plot Points Given as Ordered Pairs on the Coordinate Plane. Authored by: James Sousa (Mathispower4u.com) . Located at: https://youtu.be/p_MESleS3mw. License: CC BY: Attribution
- Unit 10: Solving Equations and Inequalities, from Developmental Math: An Open Program. Provided by: Monterey Institute of Technology and Education. Located at: http://nrocnetwork.org/resources/downloads/nroc-math-open-textbook-units-1-12-pdf-and-word-formats/. License: CC BY: Attribution
- Identify the Quadrant of a Point on the Coordinate Plane. Authored by: James Sousa (Mathispower4u.com) . Located at: https://youtu.be/iTsJsPgcE4E. License: CC BY: Attribution