Learning Outcomes
- Find the Slope from a Graph
- Identify rise and run from a graph
- Distinguish between graphs of lines with negative and positive slopes
- Find the Slope from Two Points
- Use the formula for slope to define the slope of a line through two points
- Find the Slope of Horizontal and Vertical Lines
- Find the slope of the lines [latex]x=a[/latex] and [latex]y=b[/latex]
- Recognize that horizontal lines have slope = 0
- Recognize that vertical lines have slopes that are undefined
- Identify slopes of parallel and perpendicular lines
- Given a line, identify the slope of another line that is parallel to it
- Given a line, identify the slope of another line that is perpendicular to it
- Interpret slope in equations and graphs
- Verify the slope of a linear equation given a dataset
- Interpret the slope of a linear equation as it applies to a real situation
Identify slope from a graph
The mathematical definition of slope is very similar to our everyday one. In math, slope is used to describe the steepness and direction of lines. By just looking at the graph of a line, you can learn some things about its slope, especially relative to other lines graphed on the same coordinate plane. Consider the graphs of the three lines shown below:
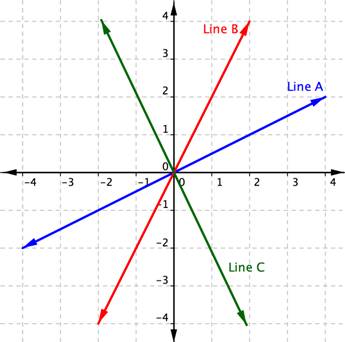
First, let’s look at lines A and B. If you imagined these lines to be hills, you would say that line B is steeper than line A. Line B has a greater slope than line A.
Next, notice that lines A and B slant up as you move from left to right. We say these two lines have a positive slope. Line C slants down from left to right. Line C has a negative slope. Using two of the points on the line, you can find the slope of the line by finding the rise and the run. The vertical change between two points is called the rise, and the horizontal change is called the run. The slope equals the rise divided by the run: [latex]\displaystyle \text{Slope }=\frac{\text{rise}}{\text{run}}[/latex].
You can determine the slope of a line from its graph by looking at the rise and run. One characteristic of a line is that its slope is constant all the way along it. So, you can choose any 2 points along the graph of the line to figure out the slope. Let’s look at an example.
Example
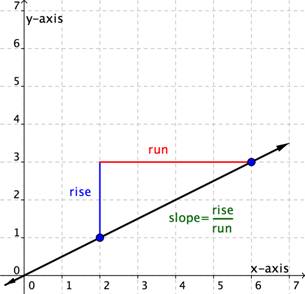
Use the graph to find the slope of the line.
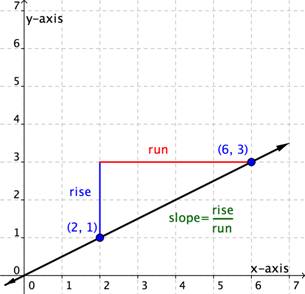
This line will have a slope of [latex]\displaystyle \frac{1}{2}[/latex] no matter which two points you pick on the line. Try measuring the slope from the origin, [latex](0,0)[/latex], to the point [latex](6,3)[/latex]. You will find that the [latex]\text{rise}=3[/latex] and the [latex]\text{run}=6[/latex]. The slope is [latex]\displaystyle \frac{\text{rise}}{\text{run}}=\frac{3}{6}=\frac{1}{2}[/latex]. It is the same!
Let’s look at another example.
Example
Use the graph to find the slope of the two lines.
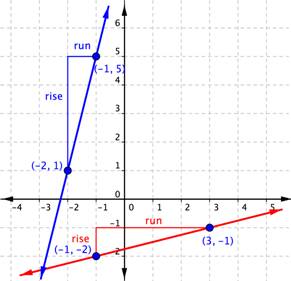
When you look at the two lines, you can see that the blue line is steeper than the red line. It makes sense the value of the slope of the blue line, 4, is greater than the value of the slope of the red line, [latex]\displaystyle \frac{1}{4}[/latex]. The greater the slope, the steeper the line.
Finding the Slope of a Line From a Graph
Distinguish between graphs of lines with negative and positive slopes
Direction is important when it comes to determining slope. It’s important to pay attention to whether you are moving up, down, left, or right; that is, if you are moving in a positive or negative direction. If you go up to get to your second point, the rise is positive. If you go down to get to your second point, the rise is negative. If you go right to get to your second point, the run is positive. If you go left to get to your second point, the run is negative.
In the following two examples, you will see a slope that is positive and one that is negative.
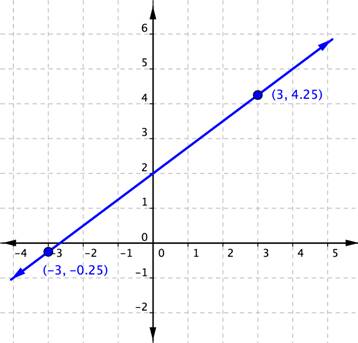
Example (Advanced)
Find the slope of the line graphed below.
The next example shows a line with a negative slope.
Example
Find the slope of the line graphed below.
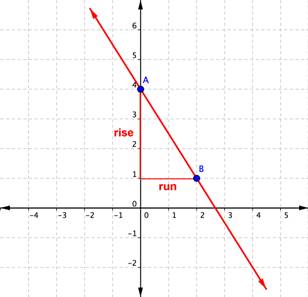
In the example above, you could have found the slope by starting at point B, running [latex]{-2}[/latex], and then rising [latex]+3[/latex] to arrive at point A. The result is still a slope of [latex]\displaystyle\frac{\text{rise}}{\text{run}}=\frac{+3}{-2}=-\frac{3}{2}[/latex].
Finding the Slope from Two Points on the Line
You’ve seen that you can find the slope of a line on a graph by measuring the rise and the run. You can also find the slope of a straight line without its graph if you know the coordinates of any two points on that line. Every point has a set of coordinates: an x-value and a y-value, written as an ordered pair (x, y). The x value tells you where a point is horizontally. The y value tells you where the point is vertically.
Consider two points on a line—Point 1 and Point 2. Point 1 has coordinates [latex]\left(x_{1},y_{1}\right)[/latex] and Point 2 has coordinates [latex]\left(x_{2},y_{2}\right)[/latex].
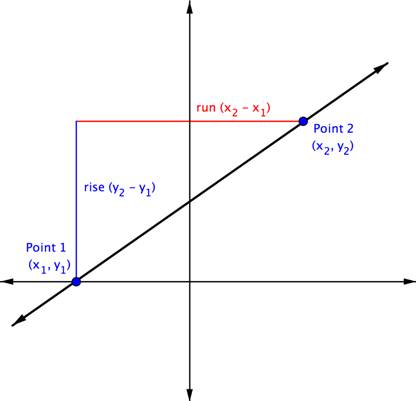
The rise is the vertical distance between the two points, which is the difference between their y-coordinates. That makes the rise [latex]\left(y_{2}-y_{1}\right)[/latex]. The run between these two points is the difference in the x-coordinates, or [latex]\left(x_{2}-x_{1}\right)[/latex].
So, [latex]\displaystyle \text{Slope}=\frac{\text{rise}}{\text{run}}[/latex] or [latex]\displaystyle m=\frac{{{y}_{2}}-{{y}_{1}}}{{{x}_{2}}-{{x}_{1}}}[/latex]
In the example below, you’ll see that the line has two points each indicated as an ordered pair. The point [latex](0,2)[/latex] is indicated as Point 1, and [latex](−2,6)[/latex] as Point 2. So you are going to move from Point 1 to Point 2. A triangle is drawn in above the line to help illustrate the rise and run.
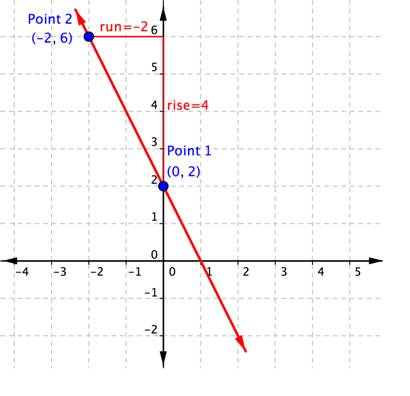
You can see from the graph that the rise going from Point 1 to Point 2 is 4, because you are moving 4 units in a positive direction (up). The run is [latex]−2[/latex], because you are then moving in a negative direction (left) 2 units. Using the slope formula,
[latex]\displaystyle \text{Slope}=\frac{\text{rise}}{\text{run}}=\frac{4}{-2}=-2[/latex].
You do not need the graph to find the slope. You can just use the coordinates, keeping careful track of which is Point 1 and which is Point 2. Let’s organize the information about the two points:
| Name | Ordered Pair | Coordinates |
|---|---|---|
| Point 1 | [latex](0,2)[/latex] | [latex]\begin{array}{l}x_{1}=0\\y_{1}=2\end{array}[/latex] |
| Point 2 | [latex](−2,6)[/latex] | [latex]\begin{array}{l}x_{2}=-2\\y_{2}=6\end{array}[/latex] |
The slope, [latex]m=\frac{y_{2}-y_{1}}{x_{2}-x_{1}}=\frac{6-2}{-2-0}=\frac{4}{-2}=-2[/latex]. The slope of the line, m, is [latex]−2[/latex].
It doesn’t matter which point is designated as Point 1 and which is Point 2. You could have called [latex](−2,6)[/latex] Point 1, and [latex](0,2)[/latex] Point 2. In that case, putting the coordinates into the slope formula produces the equation [latex]m=\frac{2-6}{0-\left(-2\right)}=\frac{-4}{2}=-2[/latex]. Once again, the slope is [latex]m=-2[/latex]. That’s the same slope as before. The important thing is to be consistent when you subtract: you must always subtract in the same order [latex]\left(y_{2},y_{1}\right)[/latex] and [latex]\left(x_{2},x_{1}\right)[/latex].
Example
What is the slope of the line that contains the points [latex](5,5)[/latex] and [latex](4,2)[/latex]?
The example below shows the solution when you reverse the order of the points, calling [latex](5,5)[/latex] Point 1 and [latex](4,2)[/latex] Point 2.
Example
What is the slope of the line that contains the points [latex](5,5)[/latex] and [latex](4,2)[/latex]?
Notice that regardless of which ordered pair is named Point 1 and which is named Point 2, the slope is still 3.
Example (Advanced)
What is the slope of the line that contains the points [latex](3,-6.25)[/latex] and [latex](-1,8.5)[/latex]?
Let’s consider a horizontal line on a graph. No matter which two points you choose on the line, they will always have the same y-coordinate. The equation for this line is [latex]y=3[/latex]. The equation can also be written as [latex]y=\left(0\right)x+3[/latex].
Video: Finding the Slope of a Line Given Two Points on the Line
Finding the Slopes of Horizontal and Vertical Lines
So far you’ve considered lines that run “uphill” or “downhill.” Their slopes may be steep or gradual, but they are always positive or negative numbers. But there are two other kinds of lines, horizontal and vertical. What is the slope of a flat line or level ground? Of a wall or a vertical line?
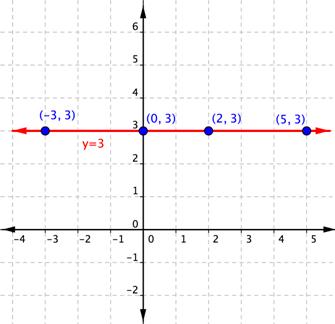
Using the form [latex]y=0x+3[/latex], you can see that the slope is 0. You can also use the slope formula with two points on this horizontal line to calculate the slope of this horizontal line. Using [latex](−3,3)[/latex] as Point 1 and (2, 3) as Point 2, you get:
[latex]\displaystyle \begin{array}{l}m=\frac{{{y}_{2}}-{{y}_{1}}}{{{x}_{2}}-{{x}_{1}}}\\\\m=\frac{3-3}{2-\left(-3\right)}=\frac{0}{5}=0\end{array}[/latex]
The slope of this horizontal line is 0.
Let’s consider any horizontal line. No matter which two points you choose on the line, they will always have the same y-coordinate. So, when you apply the slope formula, the numerator will always be 0. Zero divided by any non-zero number is 0, so the slope of any horizontal line is always 0.
The equation for the horizontal line [latex]y=3[/latex] is telling you that no matter which two points you choose on this line, the y-coordinate will always be 3.
How about vertical lines? In their case, no matter which two points you choose, they will always have the same x-coordinate. The equation for this line is [latex]x=2[/latex].
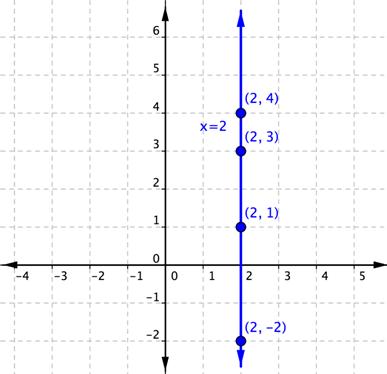
There is no way that this equation can be put in the slope-point form, as the coefficient of y is [latex]0\left(x=0y+2\right)[/latex].
So, what happens when you use the slope formula with two points on this vertical line to calculate the slope? Using [latex](2,1)[/latex] as Point 1 and [latex](2,3)[/latex] as Point 2, you get:
[latex]\displaystyle \begin{array}{l}m=\frac{{{y}_{2}}-{{y}_{1}}}{{{x}_{2}}-{{x}_{1}}}\\\\m=\frac{3-1}{2-2}=\frac{2}{0}\end{array}[/latex]
But division by zero has no meaning for the set of real numbers. Because of this fact, it is said that the slope of this vertical line is undefined. This is true for all vertical lines—they all have a slope that is undefined.
Example
What is the slope of the line that contains the points [latex](3,2)[/latex] and [latex](−8,2)[/latex]?
Finding Slopes of Horizontal and Vertical Lines
Characterize the slopes of parallel and perpendicular lines
When you graph two or more linear equations in a coordinate plane, they generally cross at a point. However, when two lines in a coordinate plane never cross, they are called parallel lines. You will also look at the case where two lines in a coordinate plane cross at a right angle. These are called perpendicular lines. The slopes of the graphs in each of these cases have a special relationship to each other.
Parallel lines are two or more lines in a plane that never intersect. Examples of parallel lines are all around us, such as the opposite sides of a rectangular picture frame and the shelves of a bookcase.
Perpendicular lines are two or more lines that intersect at a 90-degree angle, like the two lines drawn on this graph. These 90-degree angles are also known as right angles.
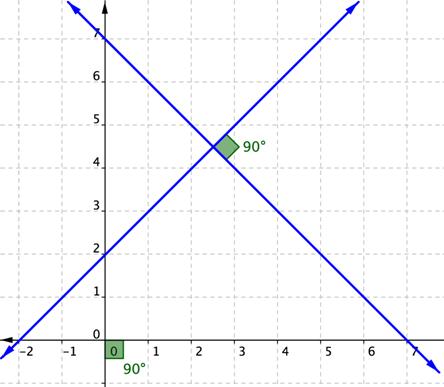
Perpendicular lines are also everywhere, not just on graph paper but also in the world around us, from the crossing pattern of roads at an intersection to the colored lines of a plaid shirt.
Parallel Lines
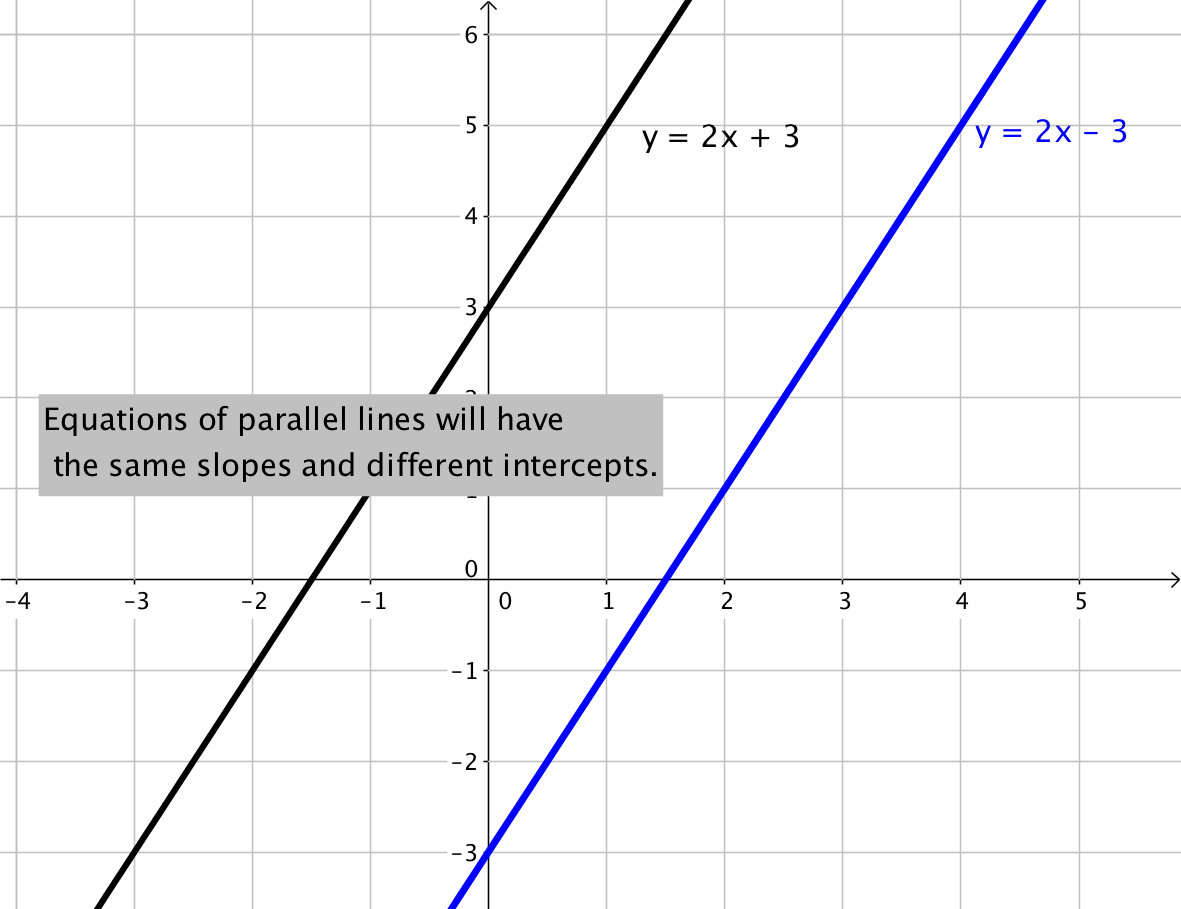
Two non-vertical lines in a plane are parallel if they have both:
- the same slope
- different y-intercepts
Any two vertical lines in a plane are parallel.
Example
Find the slope of a line parallel to the line [latex]y=−3x+4[/latex].
Example
Determine whether the lines [latex]y=6x+5[/latex] and [latex]y=6x–1[/latex] are parallel.
Perpendicular Lines
Two non-vertical lines are perpendicular if the slope of one is the negative reciprocal of the slope of the other. If the slope of the first equation is 4, then the slope of the second equation will need to be [latex]-\frac{1}{4}[/latex] for the lines to be perpendicular.
You can also check the two slopes to see if the lines are perpendicular by multiplying the two slopes together. If they are perpendicular, the product of the slopes will be [latex]−1[/latex]. For example, [latex]4\cdot-\frac{1}{4}=\frac{4}{1}\cdot-\frac{1}{4}=-1[/latex].
Example
Find the slope of a line perpendicular to the line [latex]y=2x–6[/latex].
To find the slope of a perpendicular line, find the reciprocal, [latex]\displaystyle \tfrac{1}{2}[/latex], and then find the opposite of this reciprocal [latex]\displaystyle -\tfrac{1}{2}[/latex].
Note that the product [latex]2\left(-\frac{1}{2}\right)=\frac{2}{1}\left(-\frac{1}{2}\right)=-1[/latex], so this means the slopes are perpendicular.
In the case where one of the lines is vertical, the slope of that line is undefined and it is not possible to calculate the product with an undefined number. When one line is vertical, the line perpendicular to it will be horizontal, having a slope of zero ([latex]m=0[/latex]).
Example
Determine whether the lines [latex]y=−8x+5[/latex] and [latex]\displaystyle y\,\text{=}\,\,\frac{1}{8}x-1[/latex] are parallel, perpendicular, or neither.
The Slope of Parallel and Perpendicular Lines
Verify Slope From a Dataset
Massive amounts of data is being collected every day by a wide range of institutions and groups. This data is used for many purposes including business decisions about location and marketing, government decisions about allocation of resources and infrastructure, and personal decisions about where to live or where to buy food.
In the following example, you will see how a dataset can be used to define the slope of a linear equation.
Example
Given the dataset, verify the values of the slopes of each equation.
Linear equations describing the change in median home values between 1950 and 2000 in Mississippi and Hawaii are as follows:
Hawaii: [latex]y=3966x+74,400[/latex]
Mississippi: [latex]y=924x+25,200[/latex]
The equations are based on the following dataset.
x = the number of years since 1950, and y = the median value of a house in the given state.
| Year (x) | Mississippi House Value (y) | Hawaii House Value (y) |
|---|---|---|
| 0 | $25,200 | $74,400 |
| 50 | $71,400 | $272,700 |
The slopes of each equation can be calculated with the formula you learned in the section on slope.
[latex]\displaystyle m=\frac{{{y}_{2}}-{{y}_{1}}}{{{x}_{2}}-{{x}_{1}}}[/latex]
Mississippi:
| Name | Ordered Pair | Coordinates |
|---|---|---|
| Point 1 | (0, 25,200) | [latex]\begin{array}{l}x_{1}=0\\y_{1}=25,200\end{array}[/latex] |
| Point 2 | (50, 71,400) | [latex]\begin{array}{l}x_{2}=50\\y_{2}=71,400\end{array}[/latex] |
[latex]\displaystyle m=\frac{{71,400}-{25,200}}{{50}-{0}}=\frac{{46,200}}{{50}} = 924[/latex]
We have verified that the slope [latex]\displaystyle m = 924[/latex] matches the dataset provided.
Hawaii:
| Name | Ordered Pair | Coordinates |
|---|---|---|
| Point 1 | (0, 74,400) | [latex]\begin{array}{l}x_{1}=1950\\y_{1}=74,400\end{array}[/latex] |
| Point 2 | (50, 272,700) | [latex]\begin{array}{l}x_{2}=2000\\y_{2}=272,700\end{array}[/latex] |
[latex]\displaystyle m=\frac{{272,700}-{74,400}}{{50}-{0}}=\frac{{198,300}}{{50}} = 3966[/latex]
We have verified that the slope [latex]\displaystyle m = 3966[/latex] matches the dataset provided.
Example
Given the dataset, verify the values of the slopes of the equation.
A linear equation describing the change in the number of high school students who smoke, in a group of 100, between 2011 and 2015 is given as:
[latex]y = -1.75x+16[/latex]
And is based on the data from this table, provided by the Centers for Disease Control.
x = the number of years since 2011, and y = the number of high school smokers per 100 students.
| Year | Number of High School Students Smoking Cigarettes (per 100) |
| 0 | 16 |
| 4 | 9 |
| Name | Ordered Pair | Coordinates |
|---|---|---|
| Point 1 | (0, 16) | [latex]\begin{array}{l}x_{1}=0\\y_{1}=16\end{array}[/latex] |
| Point 2 | (4, 9) | [latex]\begin{array}{l}x_{2}=4\\y_{2}=9\end{array}[/latex] |
[latex]\displaystyle m=\frac{{{y}_{2}}-{{y}_{1}}}{{{x}_{2}}-{{x}_{1}}}=\frac{{9-16}}{{4-0}} =\frac{{-7}}{{4}}=-1.75[/latex]
We have verified that the slope [latex]\displaystyle{m=-1.75}[/latex] matches the dataset provided.
Interpret the Slope of Linear Equation
Okay, now we have verified that data can provide us with the slope of a linear equation. So what? We can use this information to describe how something changes using words.
First, let’s review the different kinds of slopes possible in a linear equation.
We often use specific words to describe the different types of slopes when we are using lines and equations to represent “real” situations. The following table pairs the type of slope with the common language used to describe it both verbally and visually.
| Type of Slope | Visual Description | Verbal Description |
| positive | uphill | increasing |
| negative | downhill | decreasing |
| 0 | horizontal | constant |
| undefined | vertical | N/A |
Example
Interpret the slope of each equation for house values using words.
Hawaii: [latex]y = 3966x+74,400[/latex]
Mississippi: [latex]y = 924x+25,200[/latex]
Interpret the Meaning of the Slope Given a Linear Equation—Median Home Values
Example
Interpret the slope of the line describing the change in the number of high school smokers using words.
Apply units to the formula for slope. The x values represent years, and the y values represent the number of smokers. Remember that this dataset is per 100 high school students.
[latex]\displaystyle m=\frac{{9-16}}{{2015-2011}} =\frac{{-7 \text{ smokers}}}{{4\text{ year}}}=-1.75\frac{\text{ smokers}}{\text{ year}}[/latex]
The slope of this linear equation is negative, so this tells us that there is a decrease in the number of high school age smokers each year.
The number of high schoolers that smoke decreases by 1.75 per 100 each year.
Interpret the Meaning of the Slope of a Linear Equation—Smokers
On the next page, we will see how to interpret the y-intercept of a linear equation, and make a prediction based on a linear equation.
Summary
Slope describes the steepness of a line. The slope of any line remains constant along the line. The slope can also tell you information about the direction of the line on the coordinate plane. Slope can be calculated either by looking at the graph of a line or by using the coordinates of any two points on a line. There are two common formulas for slope: [latex]\displaystyle \text{Slope }=\frac{\text{rise}}{\text{run}}[/latex] and [latex]\displaystyle m=\frac{{{y}_{2}}-{{y}_{1}}}{{{x}_{2}}-{{x}_{1}}}[/latex] where [latex]m=\text{slope}[/latex] and [latex]\displaystyle ({{x}_{1}},{{y}_{1}})[/latex] and [latex]\displaystyle ({{x}_{2}},{{y}_{2}})[/latex] are two points on the line.
The images below summarize the slopes of different types of lines.
Candela Citations
- Revision and Adaptation. Provided by: Lumen Learning. License: CC BY: Attribution
- Interpret the Meaning of the y-intercept Given a Linear Equation. Authored by: James Sousa (Mathispower4u.com) for Lumen Learning. Located at: https://youtu.be/Yhtl28DRqfU. License: CC BY: Attribution
- Make a Prediction Using a Linear Equation - Home Value. Authored by: James Sousa (Mathispower4u.com) for Lumen Learning. Located at: https://youtu.be/Bw9XjDAl-K0. License: Public Domain: No Known Copyright
- Make a Prediction Using a Linear Equation (Horizontal Intercept) - Smokers. Authored by: James Sousa (Mathispower4u.com) for Lumen Learning. Located at: https://youtu.be/5W0qq8saxO0. License: CC BY: Attribution
- Determine the Slope of a Line From a Graph (No Formula). Authored by: Mathispower4u. Located at: https://youtu.be/29BpBqsiE5w. License: CC BY: Attribution
- Ex 1: Determine the Slope a Line Given Two Points on a Line. Authored by: James Sousa (Mathispower4u.com) . Located at: https://youtu.be/ZW7rQa8SJSU. License: CC BY: Attribution
- Unit 13: Graphing, from Developmental Math: An Open Program. Provided by: Monterey Institute of Technology and Education. Located at: http://nrocnetwork.org/resources/downloads/nroc-math-open-textbook-units-1-12-pdf-and-word-formats/. License: CC BY: Attribution
- Ex: Determine the Slope a Line Given Two Points on a Horizontal and Vertical Line. Authored by: James Sousa (Mathispower4u.com) . Located at: https://youtu.be/zoLM3rxzndo. License: CC BY: Attribution
- The Slope of Parallel and Perpendicular Lines. Authored by: James Sousa (Mathispower4u.com) . Located at: https://youtu.be/IIy4N2lAkDs. License: CC BY: Attribution
- Historical Census of Housing Tables Home Values. Authored by: United States Census Bureau. Provided by: U.S. Dept. of Housing. Located at: https://www.census.gov/hhes/www/housing/census/historic/values.html. License: Public Domain: No Known Copyright
- Youth and Tobacco Use. Authored by: Centers for Disease Control and Prevention. Provided by: U.S. Department of Health and Human Services. Located at: http://www.cdc.gov/tobacco/data_statistics/fact_sheets/youth_data/tobacco_use/index.htm. License: Public Domain: No Known Copyright