1. In precalculus, you learned a formula for the position of the maximum or minimum of a quadratic equation [latex]y=ax^2+bx+c[/latex], which was [latex]m=-\frac{b}{2a}[/latex]. Prove this formula using calculus.
2. If you are finding an absolute minimum over an interval [latex][a,b][/latex], why do you need to check the endpoints? Draw a graph that supports your hypothesis.
3. If you are examining a function over an interval [latex](a,b)[/latex], for [latex]a[/latex] and [latex]b[/latex] finite, is it possible not to have an absolute maximum or absolute minimum?
4. When you are checking for critical points, explain why you also need to determine points where [latex]f^{\prime}(x)[/latex] is undefined. Draw a graph to support your explanation.
5. Can you have a finite absolute maximum for [latex]y=ax^2+bx+c[/latex] over [latex](−\infty ,\infty )[/latex]? Explain why or why not using graphical arguments.
6. Can you have a finite absolute maximum for [latex]y=ax^3+bx^2+cx+d[/latex] over [latex](−\infty ,\infty )[/latex] assuming [latex]a[/latex] is non-zero? Explain why or why not using graphical arguments.
7. Let [latex]m[/latex] be the number of local minima and [latex]M[/latex] be the number of local maxima. Can you create a function where [latex]M>m+2[/latex]? Draw a graph to support your explanation.
8. Is it possible to have more than one absolute maximum? Use a graphical argument to prove your hypothesis.
9. Is it possible to have no absolute minimum or maximum for a function? If so, construct such a function. If not, explain why this is not possible.
10. [T] Graph the function [latex]y=e^{ax}[/latex]. For which values of [latex]a[/latex], on any infinite domain, will you have an absolute minimum and absolute maximum?
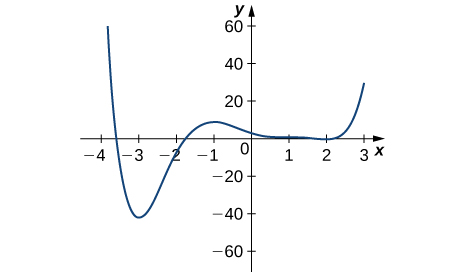
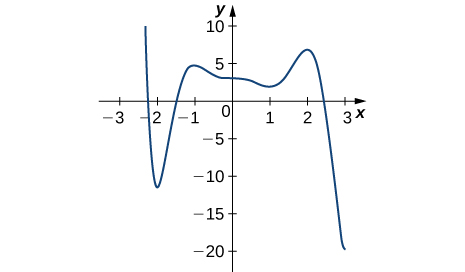
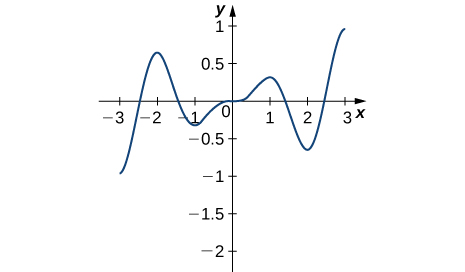
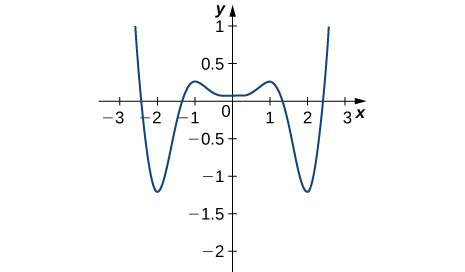
For the following exercises (11-14), determine where the local and absolute maxima and minima occur on the graph given. Assume the graph represents the entirety of each function.
For the following problems (15-18), draw graphs of [latex]f(x)[/latex], which is continuous, over the interval [latex][-4,4][/latex] with the following properties:
15. Absolute maximum at [latex]x=2[/latex] and absolute minima at [latex]x=\pm 3[/latex]
16. Absolute minimum at [latex]x=1[/latex] and absolute maximum at [latex]x=2[/latex]
17. Absolute maximum at [latex]x=4[/latex], absolute minimum at [latex]x=-1[/latex], local maximum at [latex]x=-2[/latex], and a critical point that is not a maximum or minimum at [latex]x=2[/latex]
18. Absolute maxima at [latex]x=2[/latex] and [latex]x=-3[/latex], local minimum at [latex]x=1[/latex], and absolute minimum at [latex]x=4[/latex]
For the following exercises (19-28), find the critical points in the domains of the following functions.
19. [latex]y=4x^3-3x[/latex]
20. [latex]y=4\sqrt{x}-x^2[/latex]
21. [latex]y=\frac{1}{x-1}[/latex]
22. [latex]y=\ln (x-2)[/latex]
23. [latex]y= \tan (x)[/latex]
24. [latex]y=\sqrt{4-x^2}[/latex]
25. [latex]y=x^{3/2}-3x^{5/2}[/latex]
26. [latex]y=\frac{x^2-1}{x^2+2x-3}[/latex]
27. [latex]y= \sin^2 (x)[/latex]
28. [latex]y=x+\frac{1}{x}[/latex]
For the following exercises (29-39), find the local and/or absolute maxima for the functions over the specified domain.
29. [latex]f(x)=x^2+3[/latex] over [latex][-1,4][/latex]
30. [latex]y=x^2+\frac{2}{x}[/latex] over [latex][1,4][/latex]
31. [latex]y=(x-x^2)^2[/latex] over [latex][-1,1][/latex]
32. [latex]y=\frac{1}{(x-x^2)}[/latex] over [latex](0,1)[/latex]
33. [latex]y=\sqrt{9-x}[/latex] over [latex][1,9][/latex]
34. [latex]y=x+ \sin (x)[/latex] over [latex][0,2\pi][/latex]
35. [latex]y=\frac{x}{1+x}[/latex] over [latex][0,100][/latex]
36. [latex]y=|x+1|+|x-1|[/latex] over [latex][-3,2][/latex]
37. [latex]y=\sqrt{x}-\sqrt{x^3}[/latex] over [latex][0,4][/latex]
38. [latex]y= \sin x+ \cos x[/latex] over [latex][0,2\pi][/latex]
39. [latex]y=4 \sin \theta -3 \cos \theta[/latex] over [latex][0,2\pi][/latex]
For the following exercises (40-45), find the local and absolute minima and maxima for the functions over [latex](−\infty ,\infty )[/latex].
40. [latex]y=x^2+4x+5[/latex]
41. [latex]y=x^3-12x[/latex]
42. [latex]y=3x^4+8x^3-18x^2[/latex]
43. [latex]y=x^3(1-x)^6[/latex]
44. [latex]y=\dfrac{x^2+x+6}{x-1}[/latex]
45. [latex]y=\dfrac{x^2-1}{x-1}[/latex]
For the following functions, use a calculator to graph the function and to estimate the absolute and local maxima and minima. Then, solve for them explicitly.
46. [T] [latex]y=3x\sqrt{1-x^2}[/latex]
47. [T] [latex]y=x+ \sin (x)[/latex]
48. [T] [latex]y=12x^5+45x^4+20x^3-90x^2-120x+3[/latex]
49. [T] [latex]y=\dfrac{x^3+6x^2-x-30}{x-2}[/latex]
50. [T] [latex]y=\dfrac{\sqrt{4-x^2}}{\sqrt{4+x^2}}[/latex]
51. A company that produces cell phones has a cost function of [latex]C=x^2-1200x+36,400[/latex], where [latex]C[/latex] is cost in dollars and [latex]x[/latex] is number of cell phones produced (in thousands). How many units of cell phone (in thousands) minimizes this cost function?
52. A ball is thrown into the air and its position is given by [latex]h(t)=-4.9t^2+60t+5[/latex] m. Find the height at which the ball stops ascending. How long after it is thrown does this happen?
For the following exercises (53-54), consider the production of gold during the California gold rush (1848–1888). The production of gold can be modeled by [latex]G(t)=\frac{(25t)}{(t^2+16)}[/latex], where [latex]t[/latex] is the number of years since the rush began [latex](0\le t\le 40)[/latex] and [latex]G[/latex] is ounces of gold produced (in millions). A summary of the data is shown in the following figure.
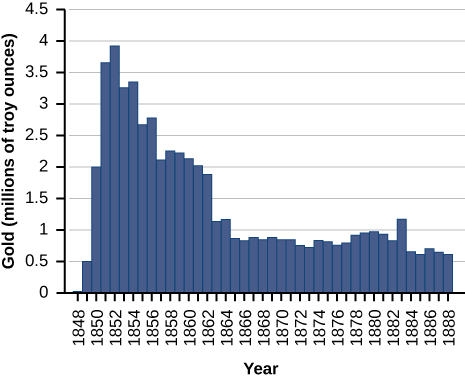
53. Find when the maximum (local and global) gold production occurred, and the amount of gold produced during that maximum.
54. Find when the minimum (local and global) gold production occurred. What was the amount of gold produced during this minimum?
Find the critical points, maxima, and minima for the following piecewise functions (55-56).
55. [latex]y=\begin{cases} x^2-4x, & 0\le x\le 1\\ x^2-4, & 1
56. [latex]y=\begin{cases} x^2+1, & x\le 1\\ x^2-4x+5, & x>1 \end{cases}[/latex]
For the following exercises (57-58), find the critical points of the following generic functions. Are they maxima, minima, or neither? State the necessary conditions.
57. [latex]y=ax^2+bx+c[/latex], given that [latex]a>0[/latex]
58. [latex]y=(x-1)^a[/latex], given that [latex]a>1[/latex]
Candela Citations
- Calculus Volume 1. Authored by: Gilbert Strang, Edwin (Jed) Herman. Provided by: OpenStax. Located at: https://openstax.org/details/books/calculus-volume-1. License: CC BY-NC-SA: Attribution-NonCommercial-ShareAlike. License Terms: Access for free at https://openstax.org/books/calculus-volume-1/pages/1-introduction
