For the following exercises (1-10), use the definition of a derivative to find [latex]f^{\prime}(x)[/latex].
1. [latex]f(x)=6[/latex]
2. [latex]f(x)=2-3x[/latex]
3. [latex]f(x)=\dfrac{2x}{7}+1[/latex]
4. [latex]f(x)=4x^2[/latex]
5. [latex]f(x)=5x-x^2[/latex]
6. [latex]f(x)=\sqrt{2x}[/latex]
7. [latex]f(x)=\sqrt{x-6}[/latex]
8. [latex]f(x)=\dfrac{9}{x}[/latex]
9. [latex]f(x)=x+\dfrac{1}{x}[/latex]
10. [latex]f(x)=\dfrac{1}{\sqrt{x}}[/latex]
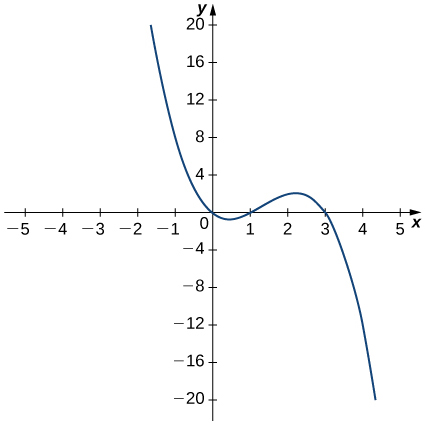
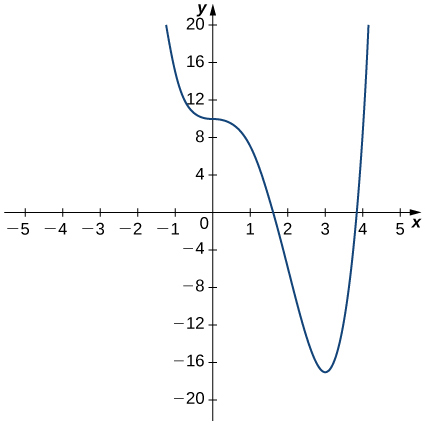
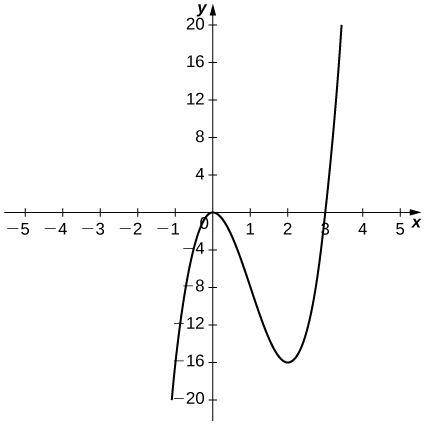
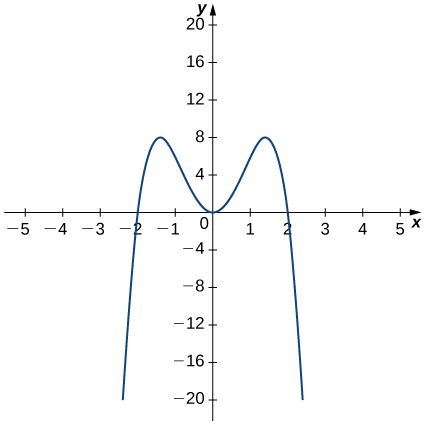
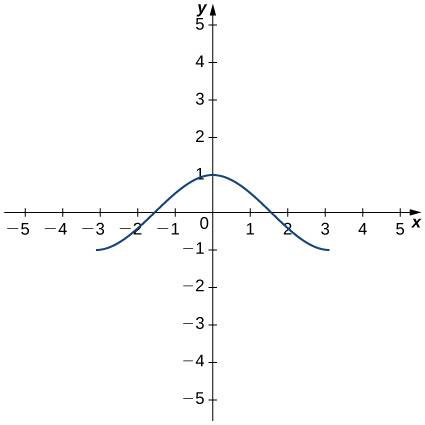
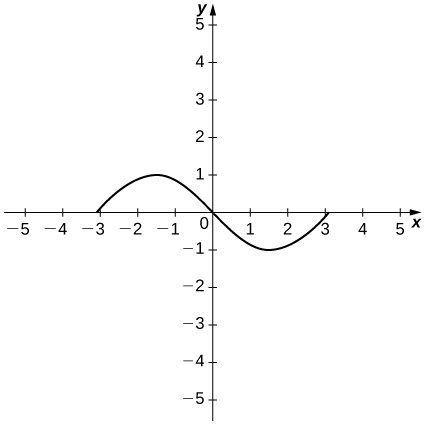
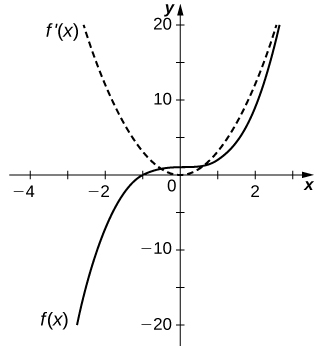
For the following exercises (11-14), use the graph of [latex]y=f(x)[/latex] to sketch the graph of its derivative [latex]f^{\prime}(x)[/latex].
For the following exercises (15-20), the given limit represents the derivative of a function [latex]y=f(x)[/latex] at [latex]x=a[/latex]. Find [latex]f(x)[/latex] and [latex]a[/latex].
15. [latex]\underset{h\to 0}{\lim}\dfrac{(1+h)^{\frac{2}{3}}-1}{h}[/latex]
16. [latex]\underset{h\to 0}{\lim}\dfrac{[3(2+h)^2+2]-14}{h}[/latex]
17. [latex]\underset{h\to 0}{\lim}\dfrac{\cos(\pi+h)+1}{h}[/latex]
18. [latex]\underset{h\to 0}{\lim}\dfrac{(2+h)^4-16}{h}[/latex]
19. [latex]\underset{h\to 0}{\lim}\dfrac{\left[2(3+h)^2-(3+h)\right]-15}{h}[/latex]
20. [latex]\underset{h\to 0}{\lim}\dfrac{e^h-1}{h}[/latex]
For the following functions (21-24),
- sketch the graph and
- use the definition of a derivative to show that the function is not differentiable at [latex]x=1[/latex].
21. [latex]f(x)=\begin{cases} 2\sqrt{x} & \text{ if } \, 0 \le x \le 1 \\ 3x-1 & \text{ if } \, x>1 \end{cases}[/latex]
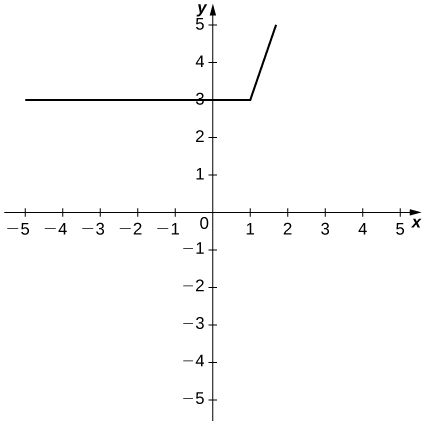
22. [latex]f(x)=\begin{cases} 3 & \text{ if } \, x<1 \\ 3x & \text{ if } \, x \ge 1 \end{cases}[/latex]
23. [latex]f(x)=\begin{cases} -x^2+2 & \text{ if } \, x \le 1 \\ x & \text{ if } \, x>1 \end{cases}[/latex]
24. [latex]f(x)=\begin{cases} 2x & \text{ if } x \le 1 \\ \dfrac{2}{x} & \text{ if } \, x>1 \end{cases}[/latex]
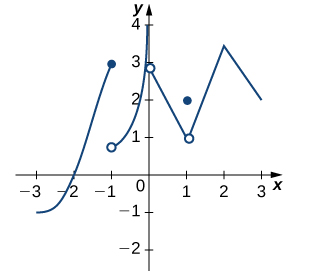
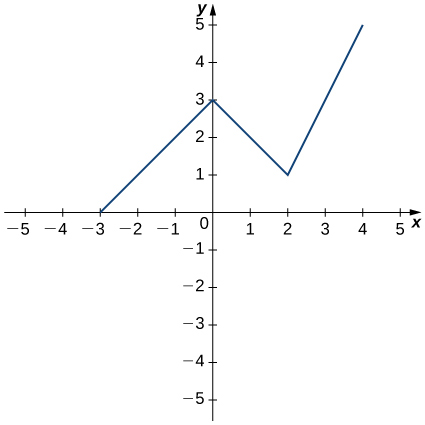
For the following graphs (25-27),
- determine for which values of [latex]x=a[/latex] the [latex]\underset{x\to a}{\lim}f(x)[/latex] exists but [latex]f[/latex] is not continuous at [latex]x=a[/latex], and
- determine for which values of [latex]x=a[/latex] the function is continuous but not differentiable at [latex]x=a[/latex].
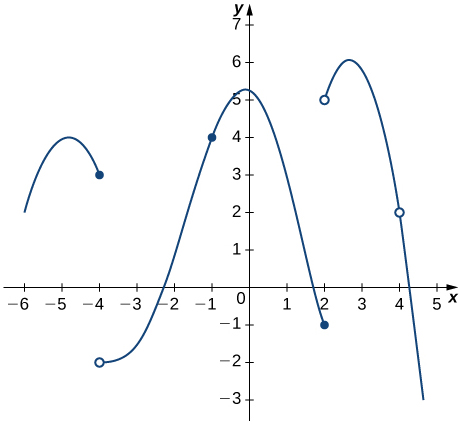
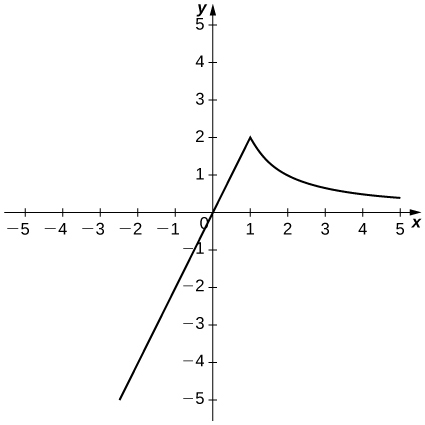
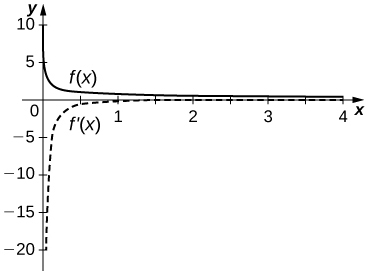
27. Use the graph to evaluate a. [latex]f^{\prime}(-0.5)[/latex], b. [latex]f^{\prime}(0)[/latex], c. [latex]f^{\prime}(1)[/latex], d. [latex]f^{\prime}(2)[/latex], and e. [latex]f^{\prime}(3)[/latex], if they exist.
For the following functions (28-30), use [latex]f''(x)=\underset{h\to 0}{\lim}\dfrac{f^{\prime}(x+h)-f^{\prime}(x)}{h}[/latex] to find [latex]f''(x)[/latex].
28. [latex]f(x)=2-3x[/latex]
29. [latex]f(x)=4x^2[/latex]
30. [latex]f(x)=x+\dfrac{1}{x}[/latex]
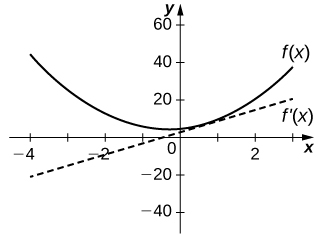
For the following exercises (31-36), use a calculator to graph [latex]f(x)[/latex]. Determine the function [latex]f^{\prime}(x)[/latex], then use a calculator to graph [latex]f^{\prime}(x)[/latex].
31. [T] [latex]f(x)=-\dfrac{5}{x}[/latex]
32. [T] [latex]f(x)=3x^2+2x+4[/latex]
33. [T] [latex]f(x)=\sqrt{x}+3x[/latex]
34. [T] [latex]f(x)=\dfrac{1}{\sqrt{2x}}[/latex]
35. [T] [latex]f(x)=1+x+\dfrac{1}{x}[/latex]
36. [T] [latex]f(x)=x^3+1[/latex]
For the following exercises (37-42), describe what the two expressions represent in terms of each of the given situations. Be sure to include units.
- [latex]\dfrac{f(x+h)-f(x)}{h}[/latex]
- [latex]f^{\prime}(x)=\underset{h\to 0}{\lim}\dfrac{f(x+h)-f(x)}{h}[/latex]
37. [latex]P(x)[/latex] denotes the population of a city at time [latex]x[/latex] in years.
38. [latex]C(x)[/latex] denotes the total amount of money (in thousands of dollars) spent on concessions by [latex]x[/latex] customers at an amusement park.
39. [latex]R(x)[/latex] denotes the total cost (in thousands of dollars) of manufacturing [latex]x[/latex] clock radios.
40. [latex]g(x)[/latex] denotes the grade (in percentage points) received on a test, given [latex]x[/latex] hours of studying.
41. [latex]B(x)[/latex] denotes the cost (in dollars) of a sociology textbook at university bookstores in the United States in [latex]x[/latex] years since 1990.
42. [latex]p(x)[/latex] denotes atmospheric pressure at an altitude of [latex]x[/latex] feet.
43. Sketch the graph of a function [latex]y=f(x)[/latex] with all of the following properties:
- [latex]f^{\prime}(x)>0[/latex] for [latex]-2\le x<1[/latex]
- [latex]f^{\prime}(2)=0[/latex]
- [latex]f^{\prime}(x)>0[/latex] for [latex]x>2[/latex]
- [latex]f(2)=2[/latex] and [latex]f(0)=1[/latex]
- [latex]\underset{x\to −\infty}{\lim}f(x)=0[/latex] and [latex]\underset{x\to \infty}{\lim}f(x)=\infty[/latex]
- [latex]f^{\prime}(1)[/latex] does not exist.
44. Suppose temperature [latex]T[/latex] in degrees Fahrenheit at a height [latex]x[/latex] in feet above the ground is given by [latex]y=T(x)[/latex].
- Give a physical interpretation, with units, of [latex]T^{\prime}(x)[/latex].
- If we know that [latex]{T}^{\prime }(1000)=-0.1,[/latex] explain the physical meaning.
45. Suppose the total profit of a company is [latex]y=P(x)[/latex] thousand dollars when [latex]x[/latex] units of an item are sold.
- What does [latex]\dfrac{P(b)-P(a)}{b-a}[/latex] for [latex]0
- What does [latex]P^{\prime}(x)[/latex] measure, and what are the units?
- Suppose that [latex]P^{\prime}(30)=5[/latex]. What is the approximate change in profit if the number of items sold increases from 30 to 31?
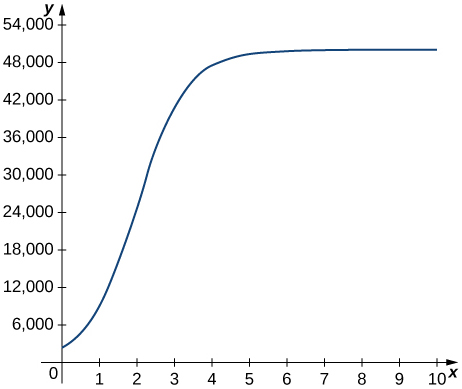
46. The graph in the following figure models the number of people [latex]N(t)[/latex] who have come down with the flu [latex]t[/latex] weeks after its initial outbreak in a town with a population of 50,000 citizens.
- Describe what [latex]N^{\prime}(t)[/latex] represents and how it behaves as [latex]t[/latex] increases.
- What does the derivative tell us about how this town is affected by the flu outbreak?
For the following exercises, use the following table, which shows the height [latex]h[/latex] of the Saturn V rocket for the Apollo 11 mission [latex]t[/latex] seconds after launch.
| Time (seconds) | Height (meters) |
|---|---|
| 0 | 0 |
| 1 | 2 |
| 2 | 4 |
| 3 | 13 |
| 4 | 25 |
| 5 | 32 |
47. What is the physical meaning of [latex]h^{\prime}(t)[/latex]? What are the units?
48. [T] Construct a table of values for [latex]h^{\prime}(t)[/latex] and graph both [latex]h(t)[/latex] and [latex]h^{\prime}(t)[/latex] on the same graph. (Hint: for interior points, estimate both the left limit and right limit and average them. An interior point of an interval [latex]I[/latex] is an element of [latex]I[/latex] which is not an endpoint of [latex]I[/latex].)
49. [T] The best linear fit to the data is given by [latex]H(t)=7.229t-4.905[/latex], where [latex]H[/latex] is the height of the rocket (in meters) and [latex]t[/latex] is the time elapsed since takeoff. From this equation, determine [latex]H^{\prime}(t)[/latex]. Graph [latex]H(t)[/latex] with the given data and, on a separate coordinate plane, graph [latex]H^{\prime}(t)[/latex].
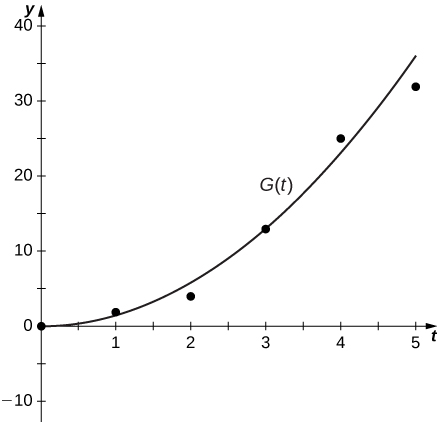
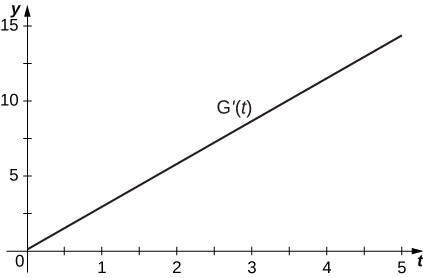
50. [T] The best quadratic fit to the data is given by [latex]G(t)=1.429t^2+0.0857t-0.1429[/latex], where [latex]G[/latex] is the height of the rocket (in meters) and [latex]t[/latex] is the time elapsed since takeoff. From this equation, determine [latex]G^{\prime}(t)[/latex]. Graph [latex]G(t)[/latex] with the given data and, on a separate coordinate plane, graph [latex]G^{\prime}(t)[/latex].
51. [T] The best cubic fit to the data is given by [latex]F(t)=0.2037t^3+2.956t^2-2.705t+0.4683[/latex], where [latex]F[/latex] is the height of the rocket (in m) and [latex]t[/latex] is the time elapsed since take off. From this equation, determine [latex]F^{\prime}(t)[/latex]. Graph [latex]F(t)[/latex] with the given data and, on a separate coordinate plane, graph [latex]F^{\prime}(t)[/latex]. Does the linear, quadratic, or cubic function fit the data best?
52. Using the best linear, quadratic, and cubic fits to the data, determine what [latex]H''(t), \, G''(t)[/latex], and [latex]F''(t)[/latex] are. What are the physical meanings of [latex]H''(t), \, G''(t)[/latex], and [latex]F''(t)[/latex], and what are their units?
Candela Citations
- Calculus Volume 1. Authored by: Gilbert Strang, Edwin (Jed) Herman. Provided by: OpenStax. Located at: https://openstax.org/details/books/calculus-volume-1. License: CC BY-NC-SA: Attribution-NonCommercial-ShareAlike. License Terms: Access for free at https://openstax.org/books/calculus-volume-1/pages/1-introduction
