Learning Outcomes
- Determine the area of a region between two curves by integrating with respect to the dependent variable
- Recognize when it is easier to integrate with respect to the independent or dependent variable
In the previous example, we had to evaluate two separate integrals to calculate the area of the region. However, there is another approach that requires only one integral. What if we treat the curves as functions of [latex]y,[/latex] instead of as functions of [latex]x?[/latex] Review the last example. Note that the left graph, shown in red, is represented by the function [latex]y=f(x)={x}^{2}.[/latex] We could just as easily solve this for [latex]x[/latex] and represent the curve by the function [latex]x=v(y)=\sqrt{y}.[/latex] (Note that [latex]x=\text{−}\sqrt{y}[/latex] is also a valid representation of the function [latex]y=f(x)={x}^{2}[/latex] as a function of [latex]y.[/latex] However, based on the graph, it is clear we are interested in the positive square root.) Similarly, the right graph is represented by the function [latex]y=g(x)=2-x,[/latex] but could just as easily be represented by the function [latex]x=u(y)=2-y.[/latex] When the graphs are represented as functions of [latex]y,[/latex] we see the region is bounded on the left by the graph of one function and on the right by the graph of the other function. Therefore, if we integrate with respect to [latex]y,[/latex] we need to evaluate one integral only. Let’s develop a formula for this type of integration.
Let [latex]u(y)[/latex] and [latex]v(y)[/latex] be continuous functions over an interval [latex]\left[c,d\right][/latex] such that [latex]u(y)\ge v(y)[/latex] for all [latex]y\in \left[c,d\right].[/latex] We want to find the area between the graphs of the functions, as shown in the following figure.
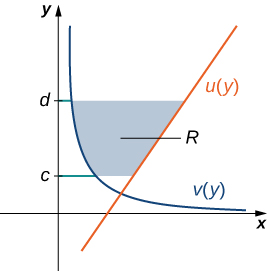
Figure 8. We can find the area between the graphs of two functions, [latex]u(y)[/latex] and [latex]v(y).[/latex]
This time, we are going to partition the interval on the [latex]y\text{-axis}[/latex] and use horizontal rectangles to approximate the area between the functions. So, for [latex]i=0,1,2\text{,…},n,[/latex] let [latex]Q=\left\{{y}_{i}\right\}[/latex] be a regular partition of [latex]\left[c,d\right].[/latex] Then, for [latex]i=1,2\text{,…},n,[/latex] choose a point [latex]{y}_{i}^{*}\in \left[{y}_{i-1},{y}_{i}\right],[/latex] then over each interval [latex]\left[{y}_{i-1},{y}_{i}\right][/latex] construct a rectangle that extends horizontally from [latex]v({y}_{i}^{*})[/latex] to [latex]u({y}_{i}^{*}).[/latex] Figure 9(a) shows the rectangles when [latex]{y}_{i}^{*}[/latex] is selected to be the lower endpoint of the interval and [latex]n=10.[/latex] Figure 9(b) shows a representative rectangle in detail.
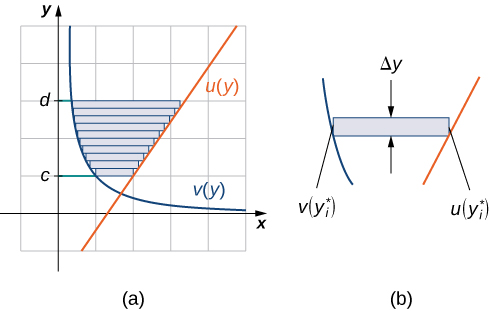
Figure 9. (a) Approximating the area between the graphs of two functions, [latex]u(y)[/latex] and [latex]v(y),[/latex] with rectangles. (b) The area of a typical rectangle.
The height of each individual rectangle is [latex]\text{Δ}y[/latex] and the width of each rectangle is [latex]u({y}_{i}^{*})-v({y}_{i}^{*}).[/latex] Therefore, the area between the curves is approximately
This is a Riemann sum, so we take the limit as [latex]n\to \infty ,[/latex] obtaining
These findings are summarized in the following theorem.
Finding the Area between Two Curves, Integrating along the [latex]y[/latex]-axis
Let [latex]u(y)[/latex] and [latex]v(y)[/latex] be continuous functions such that [latex]u(y)\ge v(y)[/latex] for all [latex]y\in \left[c,d\right].[/latex] Let [latex]R[/latex] denote the region bounded on the right by the graph of [latex]u(y),[/latex] on the left by the graph of [latex]v(y),[/latex] and above and below by the lines [latex]y=d[/latex] and [latex]y=c,[/latex] respectively. Then, the area of [latex]R[/latex] is given by
Example: Integrating with Respect to [latex]y[/latex]
Let’s revisit finding the area of a complex region, only this time let’s integrate with respect to [latex]y.[/latex] Let [latex]R[/latex] be the region depicted in Figure 10. Find the area of [latex]R[/latex] by integrating with respect to [latex]y.[/latex]
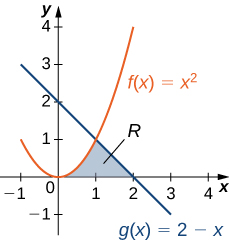
Figure 10. The area of region [latex]R[/latex] can be calculated using one integral only when the curves are treated as functions of [latex]y.[/latex]
Try It
Let’s revisit the checkpoint associated with finding the area of a complex region, only this time, let’s integrate with respect to [latex]y[/latex]. Let [latex]R[/latex] be the region depicted in the following figure. Find the area of [latex]R[/latex] by integrating with respect to [latex]y.[/latex]
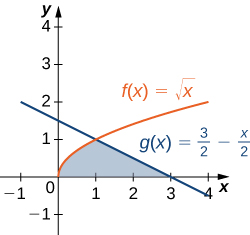
Figure 11.
Watch the following video to see the worked solution to the above Try It.
Try It
Candela Citations
- 2.1 Area Between Curves. Authored by: Ryan Melton. License: CC BY: Attribution
- Calculus Volume 1. Authored by: Gilbert Strang, Edwin (Jed) Herman. Provided by: OpenStax. Located at: https://openstax.org/details/books/calculus-volume-1. License: CC BY-NC-SA: Attribution-NonCommercial-ShareAlike. License Terms: Access for free at https://openstax.org/books/calculus-volume-1/pages/1-introduction
