Learning Outcomes
- Identify extrema and increasing and decreasing intervals
- Use a sign chart to determine where a function is positive or negative
In the Derivatives and the Shape of a Graph section, we will analyze graphs of functions using calculus. Here we will review identifying extrema and increasing and decreasing intervals of a function along with how to create sign charts to determine where a certain equation is positive or negative.
Identify Extrema and Increasing and Decreasing Intervals
We say that a function is increasing on an interval if the function values increase as the input values increase within that interval. Similarly, a function is decreasing on an interval if the function values decrease as the input values increase over that interval. The graph below shows examples of increasing and decreasing intervals on a function.
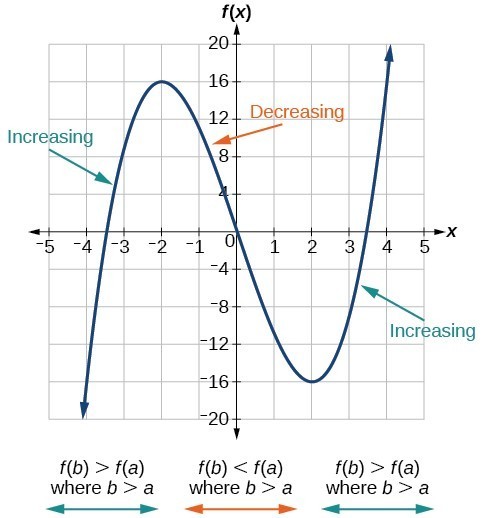
The function [latex]f\left(x\right)={x}^{3}-12x[/latex] is increasing on [latex]\left(-\infty \text{,}-\text{2}\right){{\cup }^{\text{ }}}^{\text{ }}\left(2,\infty \right)[/latex] and is decreasing on [latex]\left(-2\text{,}2\right)[/latex].
This video further explains how to find where a function is increasing or decreasing.
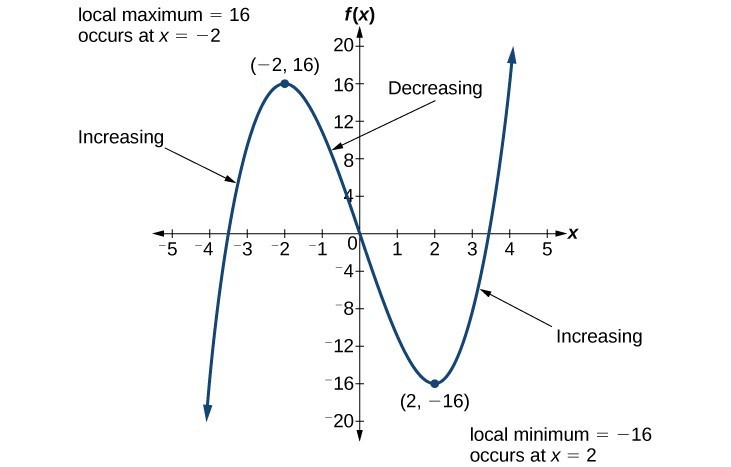
A value of the output where a function changes from increasing to decreasing (as we go from left to right, that is, as the input variable increases) is called a local maximum. If a function has more than one, we say it has local maxima. Similarly, a value of the output where a function changes from decreasing to increasing as the input variable increases is called a local minimum. The plural form is “local minima.” Together, local maxima and minima are called local extrema, or local extreme values, of the function. Often, the term local is replaced by the term relative.
For the function below, the local maximum is 16, and it occurs at [latex]x=-2[/latex]. The local minimum is [latex]-16[/latex] and it occurs at [latex]x=2[/latex].
To locate the local maxima and minima from a graph, we need to observe the graph to determine where the graph attains its highest and lowest points, respectively, within an open interval. Like the summit of a roller coaster, the graph of a function is higher at a local maximum than at nearby points on both sides. The graph will also be lower at a local minimum than at neighboring points. The graph below illustrates these ideas for a local maximum.
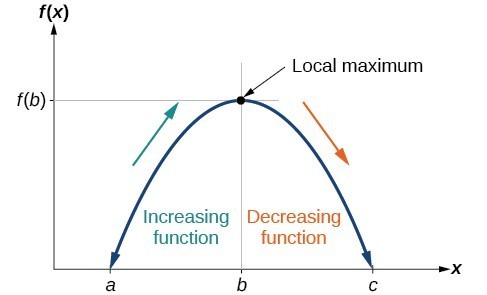
Definition of a local maximum.
These observations lead us to a formal definition of local extrema.
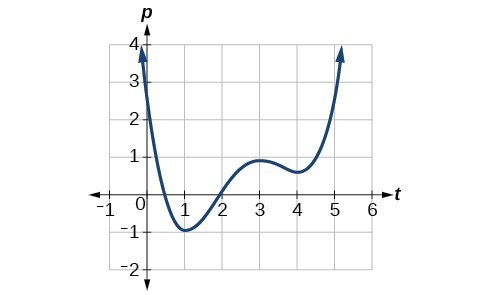
Example: Finding Increasing and Decreasing Intervals on a Graph
Given the function [latex]p\left(t\right)[/latex] in the graph below, identify the intervals on which the function appears to be increasing.
Try It
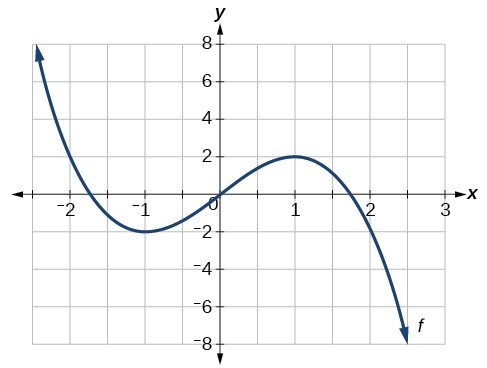
Example: Finding Local Maxima and Minima from a Graph
For the function [latex]f[/latex] whose graph is shown below, find all local maxima and minima.
Try It
Use a Sign Chart to Determine Where a Function is Positive or Negative
A sign chart can be created to determine where a function equation is positive or negative. Equations most often change signs only where the equation is equal to zero. Graphically, where an equation is equal to zero is an [latex]x[/latex]-intercept. It is at these [latex]x[/latex]-intercepts that an equation can go from being above the [latex]x[/latex]-axis (positive) to being below the [latex]x[/latex]-axis (negative) or vice-versa.
To create a sign chart (number line), we will use the critical points (where a given equation is equal to zero or not defined) to divide the number line into intervals and then determine whether the function equation is positive or negative in the interval. We then determine where the function equation is positive or negative.
Example: Determining Where a Function is Positive or Negative
Solve [latex]x^2-x-12 \ge{0}[/latex] algebraically. Write the solution in interval notation.
Try It
Solve [latex]x^2+2x-8 \ge{0}[/latex] algebraically. Write the solution in interval notation.
Try It
Solve [latex]x^2-2x-15 \le{0}[/latex] algebraically. Write the solution in interval notation.
In the previous example, since the expression [latex]x^2-x-12[/latex] factors nicely, we can find the sign of each of the factors, and then the sign of the product. Our number line would look like this:
The result is the same as we found using the other method.
Candela Citations
- Modification and Revision . Provided by: Lumen Learning. License: CC BY: Attribution
- Precalculus. Provided by: Lumen Learning. Located at: https://courses.lumenlearning.com/precalculus/. License: CC BY: Attribution
- College Algebra Corequisite. Located at: https://courses.lumenlearning.com/waymakercollegealgebracorequisite/. License: CC BY: Attribution
