Learning Outcomes
- Complete a table values with solutions to an equation
- Identify points on a graph
- Find function values (outputs) for specified numbers (inputs)
- Identify vertical and horizontal asymptotes
- Find vertical asymptotes of rational functions
The Limit of a Function section provides an introduction to how to find limits of functions. Ways to find limits will be discussed including a tabular approach and graphical approach. To prepare for this, we will review how to complete function value tables. We will also practice looking at the graph of a function and identifying the y-value or function value associated with a given x-value. Finally, we will review how to find vertical asymptotes of rational functions in order to get a head start with understanding when limit values are infinite.
Complete a Table of Function Values
A table of values can be used to organize the y-values or function values that result from plugging specific x-values into a function’s equation.
Suppose we want to determine the various values of the equation [latex]f(x)=2x - 1[/latex] at certain values of x. We can begin by substituting a value for x into the equation and determining the resulting value of the function. The table below lists some values of x from –3 to 3 and the resulting function values.
| [latex]x[/latex] | [latex]f(x)=2x - 1[/latex] |
| [latex]-3[/latex] | [latex]f(-3)=2\left(-3\right)-1=-7[/latex] |
| [latex]-2[/latex] | [latex]f(-2)=2\left(-2\right)-1=-5[/latex] |
| [latex]-1[/latex] | [latex]f(-1)=2\left(-1\right)-1=-3[/latex] |
| [latex]0[/latex] | [latex]f(0)=2\left(0\right)-1=-1[/latex] |
| [latex]2[/latex] | [latex]f(2)=2\left(2\right)-1=3[/latex] |
| [latex]3[/latex] | [latex]f(3)=2\left(3\right)-1=5[/latex] |
We can look for trends among our function values by looking at the table. For example, in this case, as x-values increase, so do the y-values. Also, it seems reasonable to assume, based on the table, an x-value of 1 would result in a function value of 1. You can verify this for yourself by plugging 1 into [latex]f(x)=2x - 1[/latex].
Example: Completing a table of function values
Create a table of function values for [latex]f(x)=-x+2[/latex]. Use various integers from -5 to 5 as the x-values you plug into the function.
Try It
Try It
Find Function Values from a Graph
We can view a function as a set of inputs and their corresponding outputs. That is, we can see a function as a set of ordered pairs, [latex]\left(x, y \right).[/latex]
Remember that, in function notation, [latex]y = f(x)[/latex], so the ordered pairs containing inputs and outputs can be written in the form of (input, output) or [latex]\left(x, f(x)\right)[/latex].
Evaluating a function using a graph requires finding the corresponding output value for a given input value, only in this case, we find the output value (y-value) by looking at the graph.
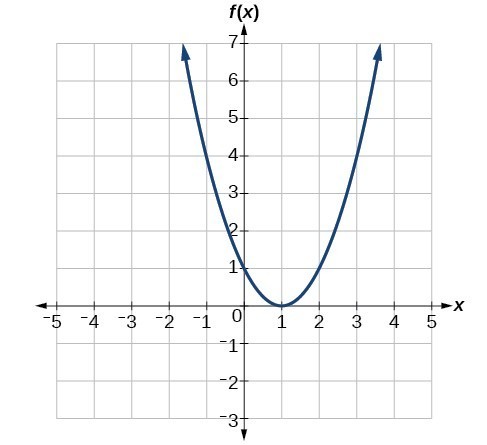
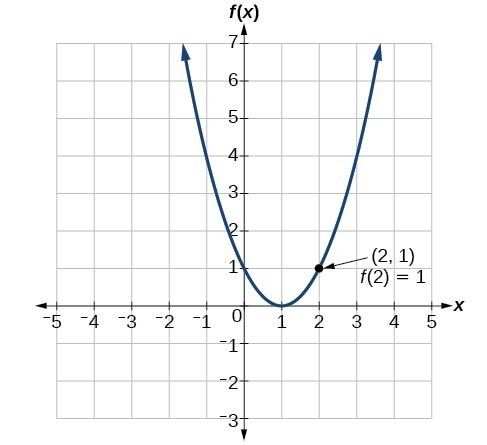
Example: Reading Function Values from a Graph
Given the graph below, evaluate [latex]f\left(2\right)[/latex].
Try It
Find Vertical Asymptotes of a Rational Function
The vertical asymptotes of a rational function may be found by examining the factors of the denominator that are not common to the factors in the numerator. Essentially, you should factor and simplify the rational function first and then set the denominator equal to 0 to find vertical asymptotes.
How To: Given a rational function, identify any vertical asymptotes of its graph.
- Factor the numerator and denominator.
- Reduce the expression by canceling common factors in the numerator and the denominator.
- Note any values that cause the denominator to be zero in this simplified version. These are where the vertical asymptotes occur.
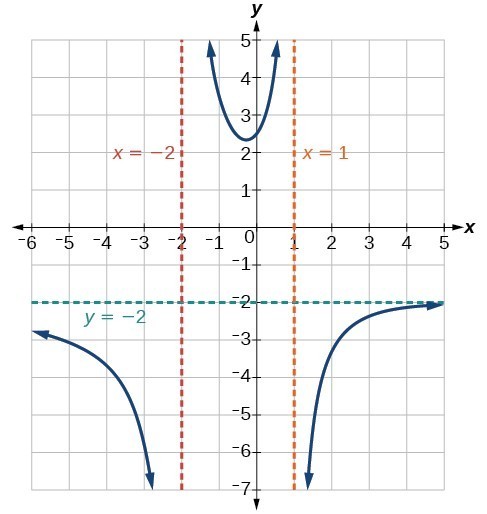
Example: Identifying Vertical Asymptotes
Find the vertical asymptotes of the graph of [latex]k\left(x\right)=\dfrac{5+2{x}^{2}}{2-x-{x}^{2}}[/latex].
Try it
Candela Citations
- Modification and Revision. Provided by: Lumen Learning. License: CC BY: Attribution
- College Algebra Corequisite. Provided by: Lumen Learning. Located at: https://courses.lumenlearning.com/waymakercollegealgebracorequisite/. License: CC BY: Attribution
- Precalculus. Provided by: Lumen Learning. Located at: https://courses.lumenlearning.com/precalculus/. License: CC BY: Attribution
