Learning Outcomes
- Describe the symmetry properties of a function
The graphs of certain functions have symmetry properties that help us understand the function and the shape of its graph. For example, consider the function [latex]f(x)=x^4-2x^2-3[/latex] shown in Figure 13(a). If we take the part of the curve that lies to the right of the [latex]y[/latex]-axis and flip it over the [latex]y[/latex]-axis, it lays exactly on top of the curve to the left of the [latex]y[/latex]-axis. In this case, we say the function has symmetry about the [latex]y[/latex]-axis. On the other hand, consider the function [latex]f(x)=x^3-4x[/latex] shown in Figure 13(b). If we take the graph and rotate it 180° about the origin, the new graph will look exactly the same. In this case, we say the function has symmetry about the origin.
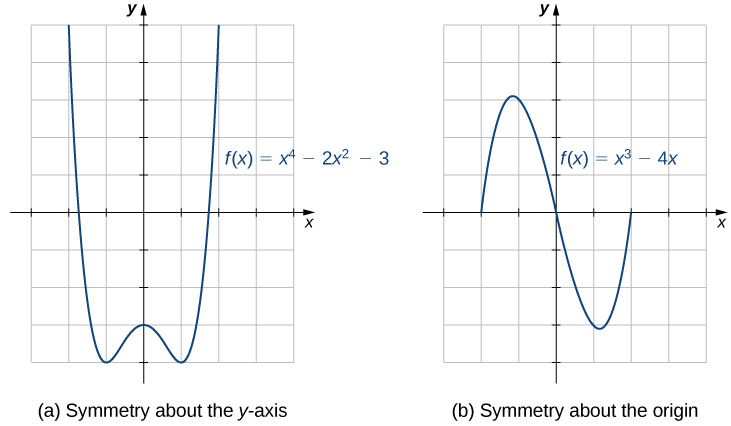
Figure 13. (a) A graph that is symmetric about the [latex]y[/latex]-axis. (b) A graph that is symmetric about the origin.
If we are given the graph of a function, it is easy to see whether the graph has one of these symmetry properties. But without a graph, how can we determine algebraically whether a function [latex]f[/latex] has symmetry? Looking at Figure 13(a) again, we see that since [latex]f[/latex] is symmetric about the [latex]y[/latex]-axis, if the point [latex](x,y)[/latex] is on the graph, the point [latex](−x,y)[/latex] is on the graph. In other words, [latex]f(−x)=f(x)[/latex]. If a function [latex]f[/latex] has this property, we say [latex]f[/latex] is an even function, which has symmetry about the [latex]y[/latex]-axis. For example, [latex]f(x)=x^2[/latex] is even because
In contrast, looking at Figure 13(b) again, if a function [latex]f[/latex] is symmetric about the origin, then whenever the point [latex](x,y)[/latex] is on the graph, the point [latex](−x,−y)[/latex] is also on the graph. In other words, [latex]f(−x)=−f(x)[/latex]. If [latex]f[/latex] has this property, we say [latex]f[/latex] is an odd function, which has symmetry about the origin. For example, [latex]f(x)=x^3[/latex] is odd because
Definition
If [latex]f(-x)=f(x)[/latex] for all [latex]x[/latex] in the domain of [latex]f[/latex], then [latex]f[/latex] is an even function. An even function is symmetric about the [latex]y[/latex]-axis.
If [latex]f(−x)=−f(x)[/latex] for all [latex]x[/latex] in the domain of [latex]f[/latex], then [latex]f[/latex] is an odd function. An odd function is symmetric about the origin.
Example: Even and Odd Functions
Determine whether each of the following functions is even, odd, or neither.
- [latex]f(x)=-5x^4+7x^2-2[/latex]
- [latex]f(x)=2x^5-4x+5[/latex]
- [latex]f(x)=\dfrac{3x}{x^2+1}[/latex]
Watch the following video to see the worked solution to Example: Even and Odd Functions
Try It
Determine whether [latex]f(x)=4x^3-5x[/latex] is even, odd, or neither.
One symmetric function that arises frequently is the absolute value function, written as [latex]|x|[/latex]. The absolute value function is defined as
Some students describe this function by stating that it “makes everything positive.” By the definition of the absolute value function, we see that if [latex]x<0[/latex], then [latex]|x|=−x>0[/latex], and if [latex]x>0[/latex], then [latex]|x|=x>0[/latex]. However, for [latex]x=0, \, |x|=0[/latex]. Therefore, it is more accurate to say that for all nonzero inputs, the output is positive, but if [latex]x=0[/latex], the output [latex]|x|=0[/latex]. We conclude that the range of the absolute value function is [latex]\{y|y\ge 0\}[/latex]. In Figure 14, we see that the absolute value function is symmetric about the [latex]y[/latex]-axis and is therefore an even function.
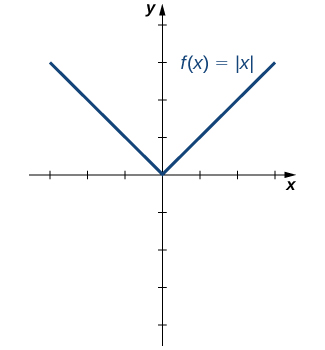
Figure 14. The graph of [latex]f(x)=|x|[/latex] is symmetric about the [latex]y[/latex]-axis.
Example: Working with the Absolute Value Function
Find the domain and range of the function [latex]f(x)=2|x-3|+4[/latex].
Watch the following video to see the worked solution to Example: Working with the Absolute Value Function
Try It
For the function [latex]f(x)=|x+2|-4[/latex], find the domain and range.
Try It
Candela Citations
- 1.1 Review of Functions. Authored by: Ryan Melton. License: CC BY: Attribution
- Calculus Volume 1. Authored by: Gilbert Strang, Edwin (Jed) Herman. Provided by: OpenStax. Located at: https://openstax.org/details/books/calculus-volume-1. License: CC BY-NC-SA: Attribution-NonCommercial-ShareAlike. License Terms: Access for free at https://openstax.org/books/calculus-volume-1/pages/1-introduction
