Drawing a Rotational Vector Field
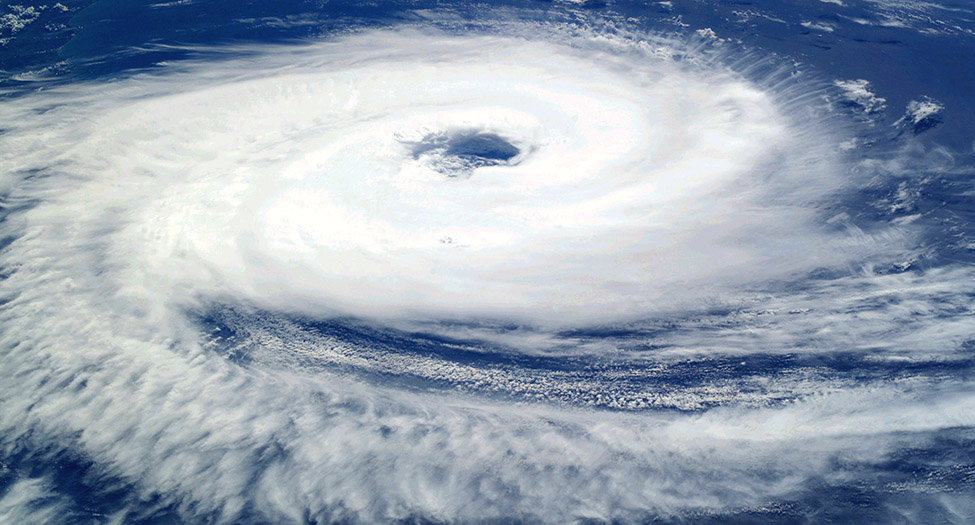
Figure 1.
Sketch the vector field [latex]{\bf{F}}(x,y)=\langle y,-x\rangle[/latex]
Solution
Create a table (see the one that follows) using a representative sample of points in a plane and their corresponding vectors.
| [latex](x,y)[/latex] | [latex]{\bf{F}}(x,y)[/latex] | [latex](x,y)[/latex] | [latex]{\bf{F}}(x,y)[/latex] | [latex](x,y)[/latex] | [latex]{\bf{F}}(x,y)[/latex] |
| [latex](1,0)[/latex] | [latex]\langle 0,-1\rangle[/latex] | [latex](2,0)[/latex] | [latex]\langle 0,-2 \rangle[/latex] | [latex](1,1)[/latex] | [latex]\langle 1,-1\rangle[/latex] |
| [latex](0,1)[/latex] | [latex]\langle 1,0\rangle[/latex] | [latex](0,2)[/latex] | [latex]\langle 2,0\rangle[/latex] | [latex](-1,1)[/latex] | [latex]\langle 1,1\rangle[/latex] |
| [latex](-1,0)[/latex] | [latex]\langle 0,1\rangle[/latex] | [latex](-2,0)[/latex] | [latex]\langle 0,2\rangle[/latex] | [latex](-1,-1)[/latex] | [latex]\langle -1,1\rangle[/latex] |
| [latex](0,-1)[/latex] | [latex]\langle -1,0\rangle[/latex] | [latex](0,-2)[/latex] | [latex]\langle -2,0\rangle[/latex] | [latex](1,-1)[/latex] | [latex]\langle -1,-1\rangle[/latex] |
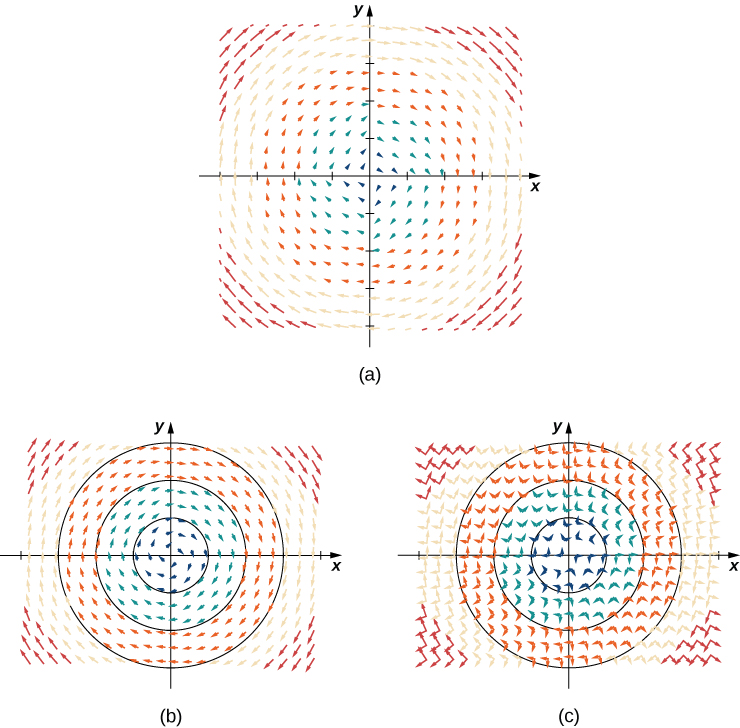
Figure 2. (a) A visual representation of vector field [latex]{\bf{F}}(x,y)=\langle y,-x\rangle[/latex]. (b) Vector field [latex]{\bf{F}}(x,y)=\langle y,-x\rangle[/latex] with circles centered at the origin. (c) Vector [latex]{\bf{F}}(a,b)[/latex] is perpendicular to radial vector [latex]\langle a,b\rangle[/latex] at point [latex](a,b)[/latex].
Analysis
Note that vector [latex]{\bf{F}}(a,b)=\langle b,-a\rangle[/latex] points clockwise and is perpendicular to radial vector [latex]\langle a,b\rangle[/latex]. (We can verify this assertion by computing the dot product of the two vectors: [latex]\langle a,b\rangle\cdot\langle -b,a\rangle= -ab+ab=0[/latex].) Furthermore, vector [latex]\langle b,-a\rangle[/latex] has length [latex]r=\sqrt{a^{2}+b^{2}}[/latex]. Thus, we have a complete description of this rotational vector field: the vector associated with point [latex](a,b)[/latex] is the vector with length [latex]r[/latex] tangent to the circle with radius [latex]r[/latex], and it points in the clockwise direction.
Sketches such as that in Figure 6 under Example “Sketching a Vector Field” are often used to analyze major storm systems, including hurricanes and cyclones. In the northern hemisphere, storms rotate counterclockwise; in the southern hemisphere, storms rotate clockwise. (This is an effect caused by Earth’s rotation about its axis and is called the Coriolis Effect.)
Candela Citations
- Calculus Volume 3. Authored by: Gilbert Strang, Edwin (Jed) Herman. Provided by: OpenStax. Located at: https://openstax.org/books/calculus-volume-3/pages/1-introduction. License: CC BY-NC-SA: Attribution-NonCommercial-ShareAlike. License Terms: Access for free at https://openstax.org/books/calculus-volume-3/pages/1-introduction