Learning Objectives
- Describe three-dimensional space mathematically.
- Locate points in space using coordinates.
As we have learned, the two-dimensional rectangular coordinate system contains two perpendicular axes: the horizontal [latex]x[/latex]-axis and the vertical [latex]y[/latex]-axis. We can add a third dimension, the [latex]z[/latex]-axis, which is perpendicular to both the [latex]x[/latex]-axis and the [latex]y[/latex]-axis. We call this system the three-dimensional rectangular coordinate system. It represents the three dimensions we encounter in real life.
definition
The three-dimensional rectangular coordinate system consists of three perpendicular axes: the [latex]x[/latex]-axis, the [latex]y[/latex]-axis, and the [latex]z[/latex]-axis. Because each axis is a number line representing all real numbers in [latex]\mathbb{R}[/latex] the three-dimensional system is often denoted by [latex]\mathbb{R}^3[/latex].
In Figure 1(a), the positive [latex]z[/latex]-axis is shown above the plane containing the [latex]x[/latex]– and [latex]y[/latex]-axes. The positive [latex]x[/latex]-axis appears to the left and the positive [latex]y[/latex]-axis is to the right. A natural question to ask is: How was arrangement determined? The system displayed follows the right-hand rule. If we take our right hand and align the fingers with the positive [latex]x[/latex]-axis, then curl the fingers so they point in the direction of the positive [latex]y[/latex]-axis, our thumb points in the direction of the positive [latex]z[/latex]-axis. In this text, we always work with coordinate systems set up in accordance with the right-hand rule. Some systems do follow a left-hand rule, but the right-hand rule is considered the standard representation.

Figure 1. (a) We can extend the two-dimensional rectangular coordinate system by adding a third axis, the [latex]z[/latex]-axis, that is perpendicular to both the [latex]x[/latex]-axis and the [latex]y[/latex]-axis. (b) The right-hand rule is used to determine the placement of the coordinate axes in the standard Cartesian plane.
In two dimensions, we describe a point in the plane with the coordinates [latex](x, y)[/latex]. Each coordinate describes how the point aligns with the corresponding axis. In three dimensions, a new coordinate, [latex]z[/latex], is appended to indicate alignment with the [latex]z[/latex]-axis: [latex](x, y, z)[/latex]. A point in space is identified by all three coordinates (Figure 2). To plot the point [latex](x, y, z)[/latex], go [latex]x[/latex] units along the [latex]x[/latex]-axis, then [latex]y[/latex] units in the direction of the [latex]y[/latex]-axis, then [latex]z[/latex] units in the direction of the [latex]z[/latex]-axis.

Figure 2. To plot the point [latex](x,y,z) [/latex] go [latex] x [/latex] units along the [latex]x[/latex]-axis, then [latex]y[/latex] units in the direction of the [latex]y[/latex]-axis, then [latex] z[/latex] units in the direction of the z-axis.
Example: locating points in space
Sketch the point [latex](1, -2, 3)[/latex] in three-dimensional space.

try it
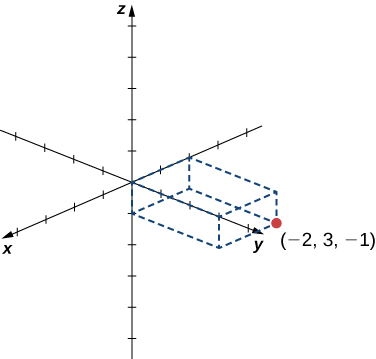
Sketch the point [latex](-2, 3, -1)[/latex] in three-dimensional space.
In two-dimensional space, the coordinate plane is defined by a pair of perpendicular axes. These axes allow us to name any location within the plane. In three dimensions, we define coordinate planes by the coordinate axes, just as in two dimensions. There are three axes now, so there are three intersecting pairs of axes. Each pair of axes forms a coordinate plane: the [latex]xy[/latex]-plane, the [latex]xz[/latex]-plane, and the [latex]yz[/latex]-plane (Figure 5). We define the [latex]xy[/latex]-plane formally as the following set: [latex]\{(x,y,0) :x,y\in\mathbb{R}\}[/latex]. Similarly, the [latex]xz[/latex]-plane and the [latex]yz[/latex]-plane are defined as [latex]\{(x,0,z) :x,z\in\mathbb{R}\}[/latex] and [latex]\{(0,y,z) :y,z\in\mathbb{R}\}[/latex], respectively.
To visualize this, imagine you’re building a house and are standing in a room with only two of the four walls finished. (Assume the two finished walls are adjacent to each other.) If you stand with your back to the corner where the two finished walls meet, facing out into the room, the floor is the [latex]xy[/latex]-plane, the wall to your right is the [latex]xz[/latex]-plane, and the wall to your left is the [latex]yz[/latex]-plane.

Figure 5. The plane containing the [latex]x[/latex]– and [latex]y [/latex]-axes is called the [latex]xy [/latex]-plane. The plane containing the [latex]x [/latex]– and [latex]z [/latex]-axes is called the [latex]xz [/latex]-plane, and the [latex]y [/latex]– and [latex]z [/latex]-axes define the [latex]yz [/latex]-plane.

Figure 6. Points that lie in octants have three nonzero coordinates.
Most work in three-dimensional space is a comfortable extension of the corresponding concepts in two dimensions. In this section, we use our knowledge of circles to describe spheres, then we expand our understanding of vectors to three dimensions. To accomplish these goals, we begin by adapting the distance formula to three-dimensional space.
If two points lie in the same coordinate plane, then it is straightforward to calculate the distance between them. We that the distance [latex]d[/latex] between two points [latex](x_1, y_1)[/latex] and [latex](x_2, y_2)[/latex] in the [latex]xy[/latex]-coordinate plane is given by the formula
The formula for the distance between two points in space is a natural extension of this formula.
theorem: the distance between two points in space
The distance [latex]d[/latex] between points [latex](x_1, y_1, z_1)[/latex] and [latex](x_2, y_2, z_2)[/latex] is given by the formula
The proof of this theorem is left as an exercise. (Hint: First find the distance [latex]d_1[/latex] between the points [latex](x_1, y_1, z_1)[/latex] and [latex](x_2, y_2, z_1)[/latex] as shown in Figure 7.)

Figure 7. The distance between [latex]P_1[/latex] and [latex]P_2[/latex] is the length of the diagonal of the rectangular prism having [latex]P_1[/latex] and [latex]P_2[/latex] as opposite corners.
Example: distance in space
Find the distance between points [latex]P_1=(3, -1, 5)[/latex] and [latex]P_2=(2, 1, -1)[/latex].

Figure 8. Find the distance between the two points.
try it
Find the distance between points [latex]P_1=(1, -5, 4)[/latex] and [latex]P_2=(4, -1, -1)[/latex].
Watch the following video to see the worked solution to the above Try It.
Before moving on to the next section, let’s get a feel for how [latex]\mathbb{R}^3[/latex] differs from [latex]\mathbb{R}^2[/latex]. For example, in [latex]\mathbb{R}^2[/latex], lines that are not parallel must always intersect. This is not the case in [latex]\mathbb{R}^3[/latex].For example, consider the line shown in Figure 9. These two lines are not parallel, nor do they intersect.

Figure 9. These two lines are not parallel, but still do not intersect.
You can also have circles that are interconnected but have no points in common, as in Figure 10.

Figure 10. These circles are interconnected, but have no points in common.
We have a lot more flexibility working in three dimensions than we do if we stuck with only two dimensions.
Candela Citations
- CP 2.12. Authored by: Ryan Melton. License: CC BY: Attribution
- Calculus Volume 3. Authored by: Gilbert Strang, Edwin (Jed) Herman. Provided by: OpenStax. Located at: https://openstax.org/books/calculus-volume-3/pages/1-introduction. License: CC BY-NC-SA: Attribution-NonCommercial-ShareAlike. License Terms: Access for free at https://openstax.org/books/calculus-volume-3/pages/1-introduction