A skateboard manufacturer introduces a new line of boards. The manufacturer tracks its costs, which is the amount it spends to produce the boards, and its revenue, which is the amount it earns through sales of its boards. How can the company determine if it is making a profit with its new line? How many skateboards must be produced and sold before a profit is possible?
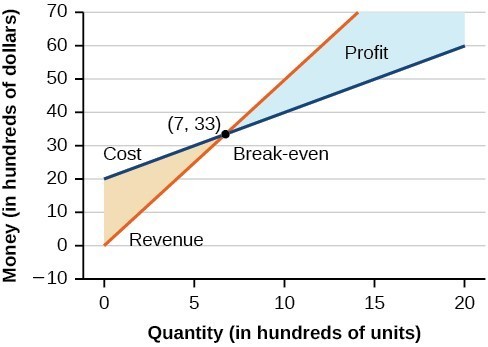
Using what we have learned about systems of equations, we can answer these questions. The skateboard manufacturer’s revenue equation is the equation used to calculate the amount of money that comes into the business. It can be represented as [latex]y=xp[/latex], where [latex]x=[/latex] quantity and [latex]p=[/latex] price. The revenue equation is shown in orange in the graph below.
The cost equation is the equation used to calculate the costs of doing business. It includes fixed costs, such as rent and salaries, and variable costs, such as utilities. The cost equation is shown in blue in the graph below. The [latex]x[/latex] -axis represents quantity in hundreds of units. The [latex]y-axis[/latex] represents both cost and revenue in hundreds of dollars. We won’t learn how to write a cost equation in this example, they will be given to you. If you take any business or economics courses, you will learn more about how to write a cost equation.
The point at which the two lines intersect is called the break-even point, we learned that this is the solution to the system of linear equations that in this case comprise the cost and revenue equations.
Read the axes of the graph carefully, note that quantity is in hundreds, and money is in thousands. The solution to the graphed system is [latex](7, 33)[/latex]. This means that if [latex]700[/latex] units are produced, the cost to make them is [latex]$3,300[/latex] and the revenue is also [latex]$3,300[/latex]. In other words, the company breaks even if they produce and sell [latex]700[/latex] units. They neither make money nor lose money.
The shaded region to the right of the break-even point represents quantities for which the company makes a profit. The shaded region to the left represents quantities for which the company suffers a loss.
Example
A business wants to manufacture bike frames. Before they start production, they need to make sure they can make a profit with the materials and labor force they have. Their accountant has given them a cost equation of [latex]y=0.85x+35,000[/latex] and a revenue equation of [latex]y=1.55x[/latex]:
Interpret [latex]x[/latex] and [latex]y[/latex] for the cost equation
Interpret [latex]x[/latex] and [latex]y[/latex] for the revenue equation
Show Solution
Cost: [latex]y=0.85x+35,000[/latex]
Revenue:[latex]y=1.55x[/latex]
The cost equation represents money leaving the company, namely how much it costs to produce a given number of bike frames. If we use the skateboard example as a model, [latex]x[/latex] would represent the number of frames produced (instead of skateboards) and y would represent the amount of money it would cost to produce them (the same as the skateboard problem).
The revenue equation represents money coming into the company, so in this context [latex]x[/latex] still represents the number of bike frames manufactured, and [latex]y[/latex] now represents the amount of money made from selling them. Let’s organize this information in a table:
Equation Type
[latex]x[/latex] represents
[latex]y[/latex] represents
Revenue Eqn.
number of frames
amount of money made selling frames
Cost Eqn.
number of frames
cost for making frames
Example
Given the same cost and revenue equations from the previous example, find the break-even point for the bike manufacturer. Interpret the solution with words.
Cost: [latex]y=0.85x+35,000[/latex]
Revenue: [latex]y=1.55x[/latex]
Show Solution
Read and Understand: We want the break even point for this system that represents cost and revenue. This means we want to find where the two lines cross, and we have learned a few different methods for doing this because this is the solution to the system of equations! Substitution looks like the easiest method since the revenue equation is already solved for [latex]y[/latex], [latex]y=1.55x[/latex].
Define and Translate: Write the system of equations.
Write and Solve: The equations are already written for us, so we just need to solve the system using substitution.
Substitute the expression [latex]0.85x+35,000[/latex] from the first equation into the second equation and solve for [latex]x[/latex].
[latex]\begin{array}{r}0.85x+35,000=1.55x\\ 35,000=0.7x\,\,\,\\ 50,000=x\,\,\,\,\,\,\,\,\,\,\end{array}\\[/latex]
Then, we substitute [latex]x=50,000[/latex] into either the cost equation or the revenue equation.
[latex]1.55\left(50,000\right)=77,500\\[/latex]
The break-even point is [latex]\left(50,000,77,500\right)[/latex].
Check and Interpret:
The solution to this system is[latex]\left(50,000,77,500\right)[/latex], but what does that mean? Think of a point as [latex]\left(x,y\right)[/latex], where in this case x is the quantity of bikes manufactured and [latex]y[/latex] is an amount of money. For our system [latex]y[/latex] represents two different things and [latex]x[/latex] represents one thing. Refer to the table we made in the first example, shown below:
Equation Type
[latex]x[/latex] represents
[latex]y[/latex] represents
Revenue Eqn.
number of frames
amount of money made selling frames
Cost Eqn.
number of frames
cost for making frames
Let’s interpret the solution with respect to the Cost equation first. [latex]x = 50,000[/latex] and [latex]y = 77,500[/latex]. Using our table, we can translate this as “the cost for producing [latex]50,000[/latex] bike frames is [latex]$75,500[/latex]“.
In the same way, the Revenue equation can be interpreted as “the amount of money the company makes from selling [latex]50,000[/latex] bike frames is [latex]$77,500[/latex]“.
Try It
In the video you will see an example of how to find the break even point for a small snow cone business.
We have seen that systems of linear equations and inequalities can help to define market behaviors that are very helpful to businesses. The intersection of cost and revenue equations gives the break even point, and also helps define the region for which a company will make a profit.
Another situation that calls for system of equations is comparison of offers available to customers.
Example
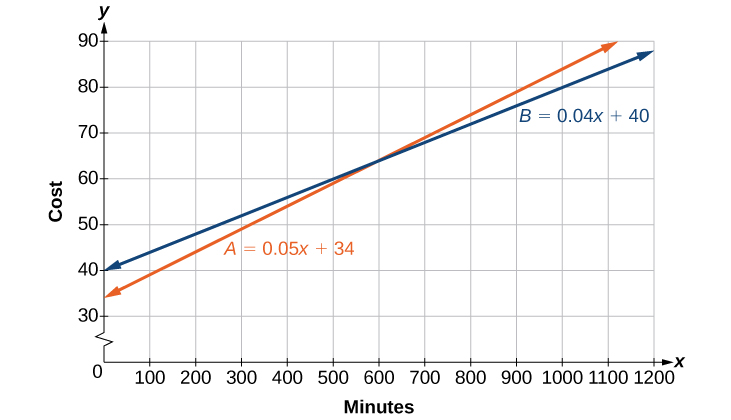
There are two cell phone companies that offer different packages. Company A charges a monthly service fee of $34 plus $.05/min talk-time. Company B charges a monthly service fee of $40 plus $.04/min talk-time.
Write a linear equation that models the packages offered by both companies.
If the average number of minutes used each month is 1,160, which company offers the better plan?
If the average number of minutes used each month is 420, which company offers the better plan?
How many minutes of talk-time would yield equal monthly statements from both companies?
Show Solution
The model for Company A can be written as [latex]A=0.05x+34[/latex]. This includes the variable cost of [latex]0.05x[/latex] plus the monthly service charge of $34. Company B’s package charges a higher monthly fee of $40, but a lower variable cost of [latex]0.04x[/latex]. Company B’s model can be written as [latex]B=0.04x+40[/latex].
If the average number of minutes used each month is 1,160, we have the following:
So, Company B offers the lower monthly cost of $86.40 as compared with the $92 monthly cost offered by Company A when the average number of minutes used each month is 1,160.
If the average number of minutes used each month is 420, we have the following:
If the average number of minutes used each month is 420, then Company A offers a lower monthly cost of $55 compared to Company B’s monthly cost of $56.80.
To answer the question of how many talk-time minutes would yield the same bill from both companies, we should think about the problem in terms of [latex]\left(x,y\right)[/latex] coordinates: At what point are both the x-value and the y-value equal? We can find this point by setting the equations equal to each other and solving for x.
Therefore, a monthly average of 600 talk-time minutes renders the plans equal.
Example
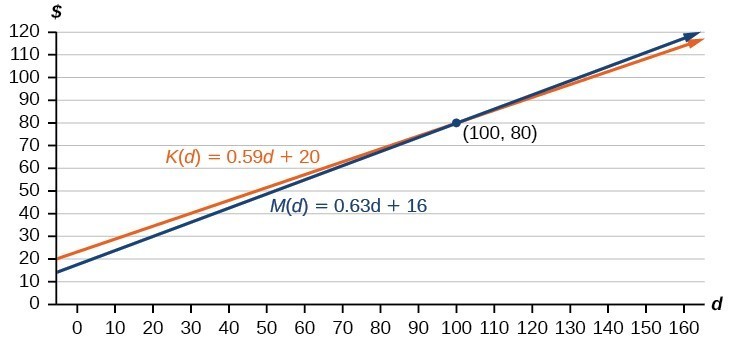
Jamal is choosing between two truck-rental companies. The first, Keep on Trucking, Inc., charges an up-front fee of $20, then 59 cents a mile. The second, Move It Your Way, charges an up-front fee of $16, then 63 cents a mile1. When will Keep on Trucking, Inc. be the better choice for Jamal?
Solution
The two important quantities in this problem are the cost and the number of miles driven. Because we have two companies to consider, we will define two functions.
Input
d, distance driven in miles
Outputs
K(d): cost, in dollars, for renting from Keep on TruckingM(d) cost, in dollars, for renting from Move It Your Way
Initial Value
Up-front fee: K(0) = 20 and M(0) = 16
Rate of Change
K(d) = $0.59/mile and P(d) = $0.63/mile
A linear function is of the form [latex]f\left(x\right)=mx+b[/latex]. Using the rates of change and initial charges, we can write the equations
Using these equations, we can determine when Keep on Trucking, Inc., will be the better choice. Because all we have to make that decision from is the costs, we are looking for when Move It Your Way, will cost less, or when [latex]K\left(d\right)
Figure 7
These graphs are sketched in Figure 7, with K(d) in blue.
To find the intersection, we set the equations equal and solve:
This tells us that the cost from the two companies will be the same if 100 miles are driven. Either by looking at the graph, or noting that [latex]K\left(d\right)[/latex] is growing at a slower rate, we can conclude that Keep on Trucking, Inc. will be the cheaper price when more than 100 miles are driven, that is [latex]d>100[/latex].
Contribute!
Did you have an idea for improving this content? We’d love your input.