1. Find the x- and y-intercepts of the equation 2x + 7y = –14.
2. Given the following set of information, find a linear equation satisfying the conditions, if possible.
Passes through (5, 1) and (3, –9)
3. Given the following set of information, find a linear equation satisfying the conditions, if possible.
x intercept at (–4, 0) and y-intercept at (0, –6)
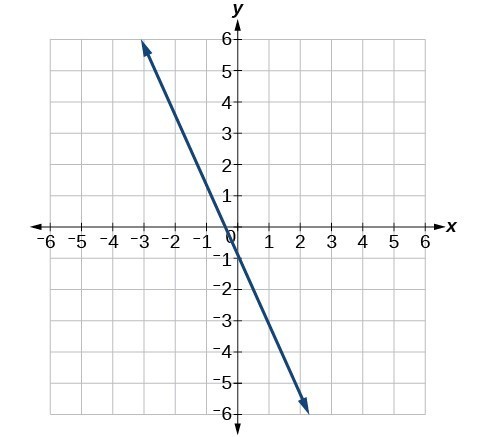
4. Find the slope of the line in the graph below.
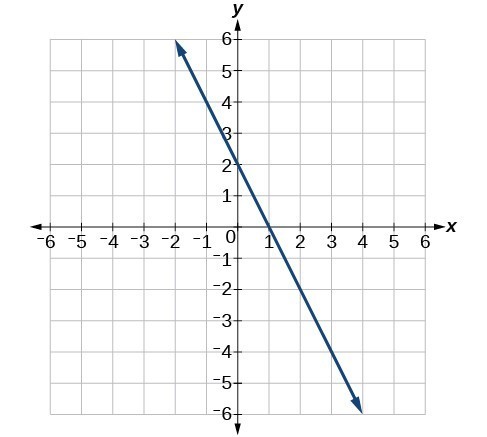
5. Write an equation for line in the graph below.
6. Does the table below represent a linear function? If so, find a linear equation that models the data.
| x | –6 | 0 | 2 | 4 |
| g(x) | 14 | 32 | 38 | 44 |
7. Does the table below represent a linear function? If so, find a linear equation that models the data.
| x | 1 | 3 | 7 | 11 |
| g(x) | 4 | 9 | 19 | 12 |
8. At 6 am, an online company has sold 120 items that day. If the company sells an average of 30 items per hour for the remainder of the day, write an expression to represent the number of items that were sold [latex]n[/latex] after 6 am.
9. Graph the linear function f(x) = –x + 6 .
10. Sketch a line with a y-intercept of (0, 5) and slope [latex]-\frac{5}{2}[/latex]
11. A town’s population increases at a constant rate. In 2010 the population was 65,000. By 2012 the population had increased to 90,000. Assuming this trend continues, predict the population in 2018.
12. The number of people afflicted with the common cold in the winter months dropped steadily by 25 each year since 2002 until 2012. In 2002, 8,040 people were inflicted. Find the linear function that models the number of people afflicted with the common cold C as a function of the year, t. When will less than 6,000 people be afflicted?
For the exercises 13-14, use the graph below, showing the profit, y, in thousands of dollars, of a company in a given year, x, where x represents years since 1980.
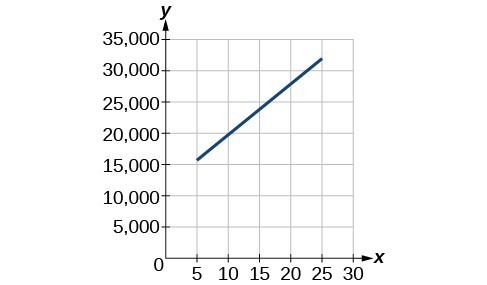
13. Find the linear function y, where y depends on x, the number of years since 1980.
14. Find and interpret the y-intercept.
15. In 2004, a school population was 1250. By 2012 the population had dropped to 875. Assume the population is changing linearly.
a. How much did the population drop between the year 2004 and 2012?
b. What is the average population decline per year?
c. Find an equation for the population, P, of the school t years after 2004.
Candela Citations
- Precalculus. Authored by: Jay Abramson, et al.. Provided by: OpenStax. Located at: http://cnx.org/contents/fd53eae1-fa23-47c7-bb1b-972349835c3c@5.175. License: CC BY: Attribution. License Terms: Download For Free at : http://cnx.org/contents/fd53eae1-fa23-47c7-bb1b-972349835c3c@5.175.