
Figure 9
Some functions have a given output value that corresponds to two or more input values. For example, in the following stock chart the stock price was $1000 on five different dates, meaning that there were five different input values that all resulted in the same output value of $1000.
However, some functions have only one input value for each output value, as well as having only one output for each input. We call these functions one-to-one functions. As an example, consider a school that uses only letter grades and decimal equivalents, as listed in.
| Letter grade | Grade point average |
|---|---|
| A | 4.0 |
| B | 3.0 |
| C | 2.0 |
| D | 1.0 |
This grading system represents a one-to-one function, because each letter input yields one particular grade point average output and each grade point average corresponds to one input letter.
To visualize this concept, let’s look again at the two simple functions sketched in (a)and (b) of Figure 10.
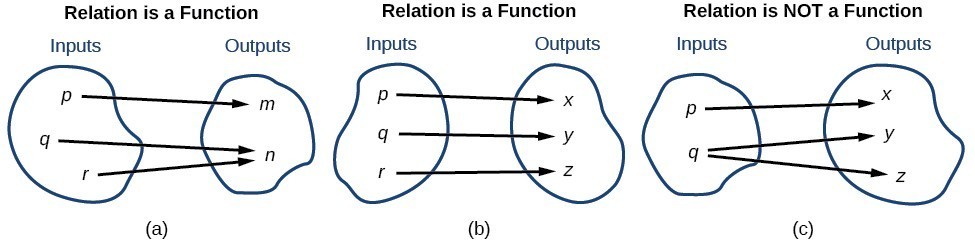
Figure 10
The function in part (a) shows a relationship that is not a one-to-one function because inputs [latex]q[/latex] and [latex]r[/latex] both give output [latex]n[/latex]. The function in part (b) shows a relationship that is a one-to-one function because each input is associated with a single output.
A General Note: One-to-One Function
A one-to-one function is a function in which each output value corresponds to exactly one input value.
Example: Determining Whether a Relationship Is a One-to-One Function
Is the area of a circle a function of its radius? If yes, is the function one-to-one?
Try It
- Is a balance a function of the bank account number?
- Is a bank account number a function of the balance?
- Is a balance a one-to-one function of the bank account number?
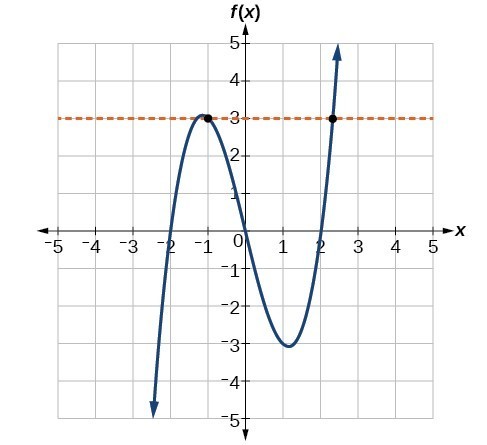
The Horizontal Line Test
Once we have determined that a graph defines a function, an easy way to determine if it is a one-to-one function is to use the horizontal line test. Draw horizontal lines through the graph. A horizontal line includes all points with a particular [latex]y[/latex] value. The [latex]x[/latex] value of a point where a vertical line intersects a function represents the input for that output [latex]y[/latex] value. If we can draw any horizontal line that intersects a graph more than once, then the graph does not represent a one-to-one function because that [latex]y[/latex] value has more than one input.
How To: Given a graph of a function, use the horizontal line test to determine if the graph represents a one-to-one function.
- Inspect the graph to see if any horizontal line drawn would intersect the curve more than once.
- If there is any such line, the function is not one-to-one.
- If no horizontal line can intersect the curve more than once, the function is one-to-one.
Example: Applying the Horizontal Line Test
Consider the functions (a), and (b)shown in the graphs below.
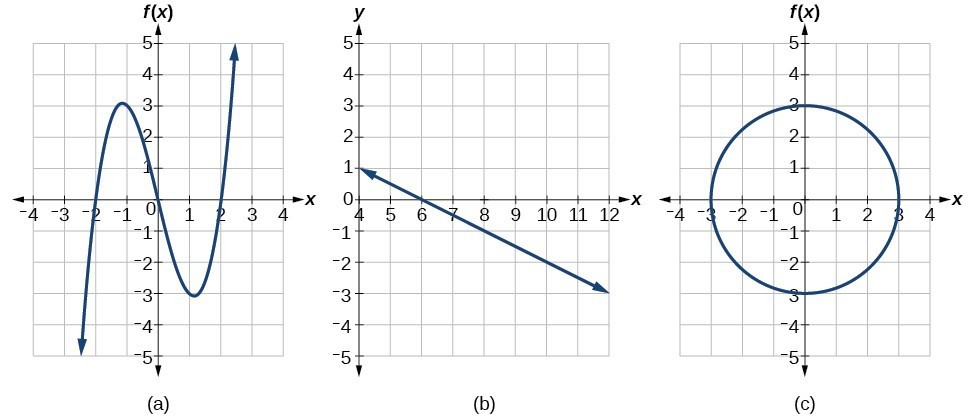
Are either of the functions one-to-one?
Key Concepts
- A function is one-to-one if each output value corresponds to only one input value.
- A graph represents a one-to-one function if any horizontal line drawn on the graph intersects the graph at no more than one point.
Candela Citations
- Precalculus. Authored by: Jay Abramson, et al.. Provided by: OpenStax. Located at: http://cnx.org/contents/fd53eae1-fa23-47c7-bb1b-972349835c3c@5.175. License: CC BY: Attribution. License Terms: Download For Free at : http://cnx.org/contents/fd53eae1-fa23-47c7-bb1b-972349835c3c@5.175.