Earlier in this section, we used Venn diagrams to depict “and” statements, “or” statements, and implications (“if…then…” statements). Now that we can depict these statements, we can use Venn diagrams to analyze arguments and determine their validity.
Analyzing Arguments with Venn Diagrams
To analyze an argument with a Venn diagram
- Draw a Venn diagram based on the claims (premises) of the argument.
- The argument is valid if it is clear that the conclusion must be true.
Example
Consider the following argument:
| Claim 1: |
If a shape is a square, then it is a rectangle. |
| Claim 2: |
If a shape is a rectangle, then it is a quadrilateral. |
| Conclusion: |
If a shape is a square, then it is a quadrilateral. |
Draw a Venn diagram to show that the conclusion follows from the two claims (i.e. show that it is a valid argument).
Show Solution
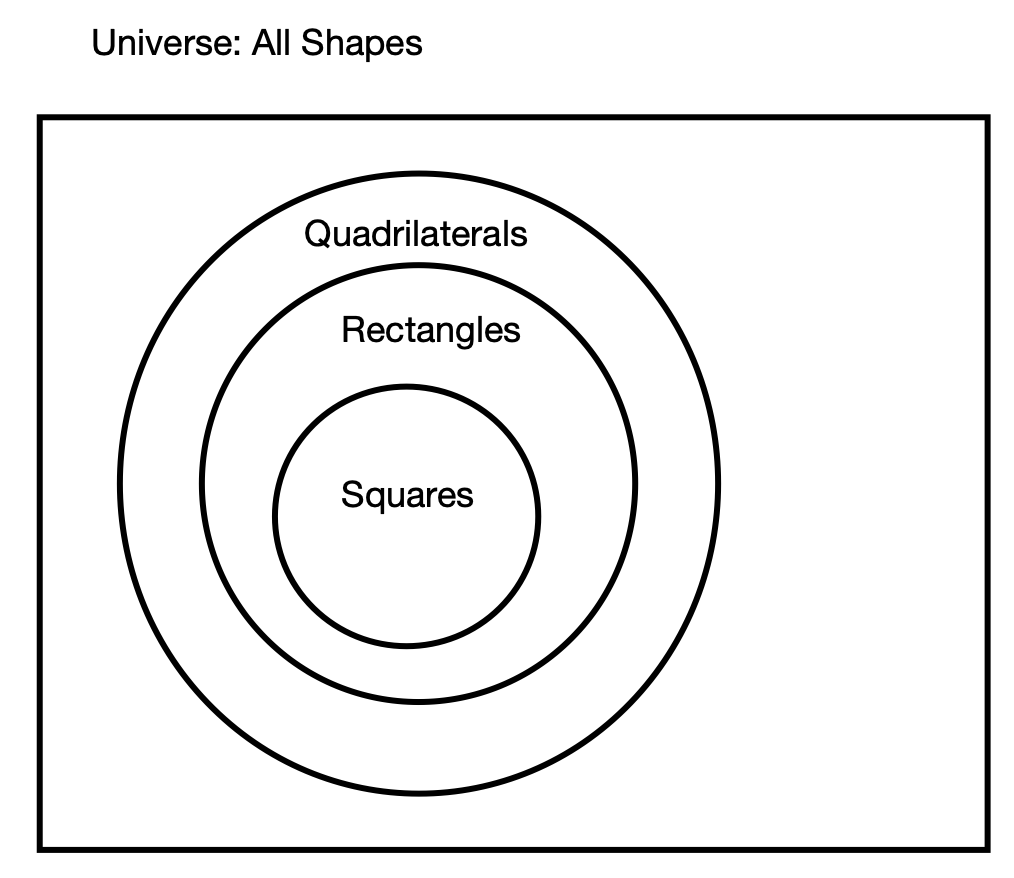
To do this, we remember from the last section that the first claim, “if a shape is a square, then it is a rectangle,” means the set of squares is a subset of the set of rectangles. Similarly, the second claim means the set of rectangles is a subset of the set of quadrilaterals. This means that we have three nested sets: squares are a subset of rectangles which are in turn a subset of quadrilaterals. This gives the following Venn diagram.
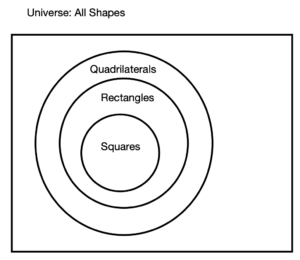
Note that the diagram shows that the conclusion, squares are a subset of quadrilaterals, follows from the two claims. We see this because the set of squares is contained in the set of quadrilaterals.
The previous example is an example of something called a syllogism.
Syllogism
A syllogism is an implication derived from two others, where the consequence of one is the antecedent to the other. The general form of a syllogism is:
| Claim: |
[latex]p{\rightarrow}q[/latex] |
| Claim: |
[latex]q{\rightarrow}r[/latex] |
| Conclusion: |
[latex]p{\rightarrow}r[/latex] |
This is sometimes called the transitive property for implication.
Note: Informally, we can think about a syllogism as saying that we can put together an arrow from [latex]p[/latex] to [latex]q[/latex] with an arrow from [latex]q[/latex] to [latex]r[/latex] to get an arrow from [latex]p[/latex] to [latex]r[/latex].
Example
Analyze the following argument.
| Claim 1: |
If I work hard, then I’ll get a raise. |
| Claim 2: |
If I get a raise, then I’ll buy a boat. |
| Conclusion: |
If I work hard, then I’ll buy a boat. |
Show Solution
This is a logically valid argument. To see this, we can notice that this is another example of a Syllogism.
Note, we could have also used a Venn diagram to show that this is a valid argument. The first claim means that the set of people who work hard is a subset of people who get raises. The second claim means the set of people who get raises is a subset of people who buy boats. Putting these two claims together means the set of people who work hard is a subset of people who buy boats which means the conclusion holds.
Example
Use a Venn diagram to analyze the validity of the following argument.
| Claim 1: |
If you have been to Denver, you have been to Colorado. |
| Claim 2: |
Rafik has been to Denver or Chicago. |
| Conclusion: |
Rafik has been to Colorado. |
Show Solution
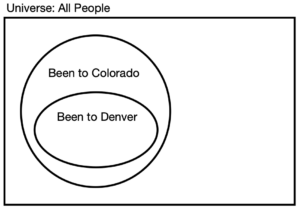
We will draw a Venn diagram which depicts the first two claims and determine whether the conclusion is true. The first claim means that set of people who have been to Denver is a subset of people who have been to Colorado. We can draw this as follows.
Next, we need to add the information from the second claim to the diagram. To do so, we need another set: the set of people who have been to Chicago. We need to draw this as generally as possible. There is nothing in the two claims which implies that all people who have been to Chicago have been to Colorado, so we draw this as:
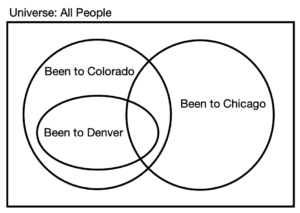
Next, we need to determine which regions Rafik could be in. Since Rafik has been to Denver or Chicago, Rafik must be somewhere in the union of those sets. In this case, there are 4 different regions in the union, so we place dots in those 4 regions which represent the possibilities for Rafik.
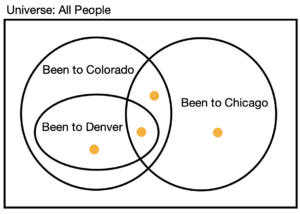
Finally, we check whether the conclusion is guaranteed by the diagram. Notice that in one of the possibilities, Rafik has not been to Colorado, so the conclusion doesn’t necessarily follow from the claims and the argument is invalid.
End of Section 4.4
Candela Citations
CC licensed content, Original
CC licensed content, Shared previously