Learning Outcomes
- Define the components of the Cartesian coordinate system.
- Plot points on the Cartesian coordinate plane.
- Use the distance formula to find the distance between two points in the plane.
- Use the midpoint formula to find the midpoint between two points.
- Plot linear equations in two variables on the coordinate plane.
- Use intercepts to plot lines.
- Use a graphing utility to graph a linear equation on a coordinate plane.
An old story describes how seventeenth-century philosopher/mathematician René Descartes invented the system that has become the foundation of algebra while sick in bed. According to the story, Descartes was staring at a fly crawling on the ceiling when he realized that he could describe the fly’s location in relation to the perpendicular lines formed by the adjacent walls of his room. He viewed the perpendicular lines as horizontal and vertical axes. Further, by dividing each axis into equal unit lengths, Descartes saw that it was possible to locate any object in a two-dimensional plane using just two numbers—the displacement from the horizontal axis and the displacement from the vertical axis.
While there is evidence that ideas similar to Descartes’ grid system existed centuries earlier, it was Descartes who introduced the components that comprise the Cartesian coordinate system, a grid system having perpendicular axes. Descartes named the horizontal axis the x-axis and the vertical axis the y-axis.
The Cartesian coordinate system, also called the rectangular coordinate system, is based on a two-dimensional plane consisting of the x-axis and the y-axis. Perpendicular to each other, the axes divide the plane into four sections. Each section is called a quadrant; the quadrants are numbered counterclockwise as shown in the figure below.
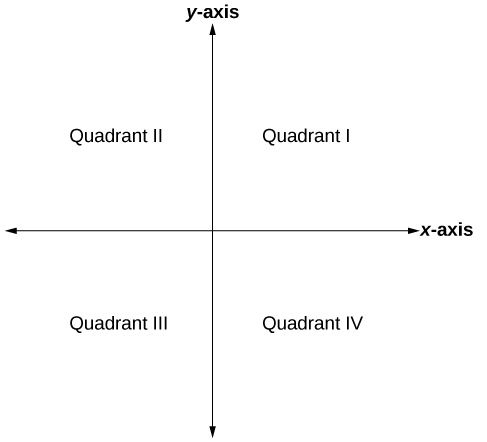
The Cartesian coordinate system with all four quadrants labeled.
Try It
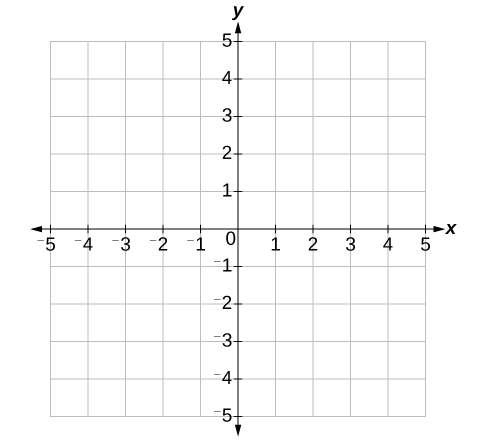
The center of the plane is the point at which the two axes cross. It is known as the origin or point [latex]\left(0,0\right)[/latex]. From the origin, each axis is further divided into equal units: increasing, positive numbers to the right on the x-axis and up the y-axis; decreasing, negative numbers to the left on the x-axis and down the y-axis. The axes extend to positive and negative infinity as shown by the arrowheads in the figure below.
Each point in the plane is identified by its x-coordinate, or horizontal displacement from the origin, and its y-coordinate, or vertical displacement from the origin. Together we write them as an ordered pair indicating the combined distance from the origin in the form [latex]\left(x,y\right)[/latex]. An ordered pair is also known as a coordinate pair because it consists of x and y-coordinates. For example, we can represent the point [latex]\left(3,-1\right)[/latex] in the plane by moving three units to the right of the origin in the horizontal direction and one unit down in the vertical direction.
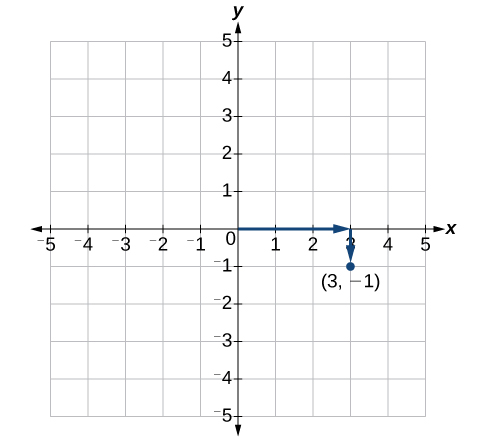
An illustration of how to plot the point (3,-1).
When dividing the axes into equally spaced increments, note that the x-axis may be considered separately from the y-axis. In other words, while the x-axis may be divided and labeled according to consecutive integers, the y-axis may be divided and labeled by increments of 2 or 10 or 100. In fact, the axes may represent other units such as years against the balance in a savings account or quantity against cost. Consider the rectangular coordinate system primarily as a method for showing the relationship between two quantities.
A General Note: Cartesian Coordinate System
A two-dimensional plane where the
- x-axis is the horizontal axis
- y-axis is the vertical axis
A point in the plane is defined as an ordered pair, [latex]\left(x,y\right)[/latex], such that x is determined by its horizontal distance from the origin and y is determined by its vertical distance from the origin.
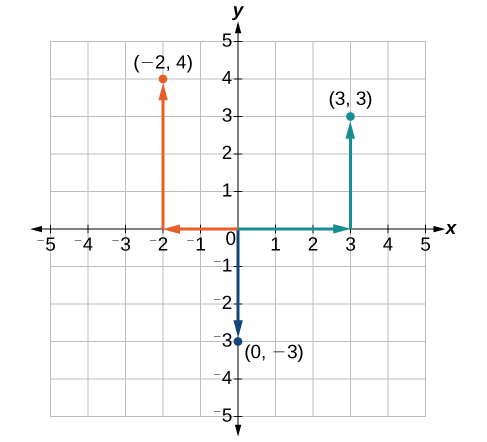
Example: Plotting Points in a Rectangular Coordinate System
Plot the points [latex]\left(-2,4\right)[/latex], [latex]\left(3,3\right)[/latex], and [latex]\left(0,-3\right)[/latex] in the coordinate plane.
Try It
Graphing Lines by Plotting Points
We can plot a set of points to represent an equation. When such an equation contains both an x variable and a y variable, it is called an equation in two variables. Its graph is called a graph in two variables. Any graph on a two-dimensional plane is a graph in two variables.
Suppose we want to graph the equation [latex]y=2x - 1[/latex]. We can begin by substituting a value for x into the equation and determining the resulting value of y. Each pair of x and y-values is an ordered pair that can be plotted. The table below lists values of x from –3 to 3 and the resulting values for y.
| [latex]x[/latex] | [latex]y=2x - 1[/latex] | [latex]\left(x,y\right)[/latex] |
| [latex]-3[/latex] | [latex]y=2\left(-3\right)-1=-7[/latex] | [latex]\left(-3,-7\right)[/latex] |
| [latex]-2[/latex] | [latex]y=2\left(-2\right)-1=-5[/latex] | [latex]\left(-2,-5\right)[/latex] |
| [latex]-1[/latex] | [latex]y=2\left(-1\right)-1=-3[/latex] | [latex]\left(-1,-3\right)[/latex] |
| [latex]0[/latex] | [latex]y=2\left(0\right)-1=-1[/latex] | [latex]\left(0,-1\right)[/latex] |
| [latex]1[/latex] | [latex]y=2\left(1\right)-1=1[/latex] | [latex]\left(1,1\right)[/latex] |
| [latex]2[/latex] | [latex]y=2\left(2\right)-1=3[/latex] | [latex]\left(2,3\right)[/latex] |
| [latex]3[/latex] | [latex]y=2\left(3\right)-1=5[/latex] | [latex]\left(3,5\right)[/latex] |
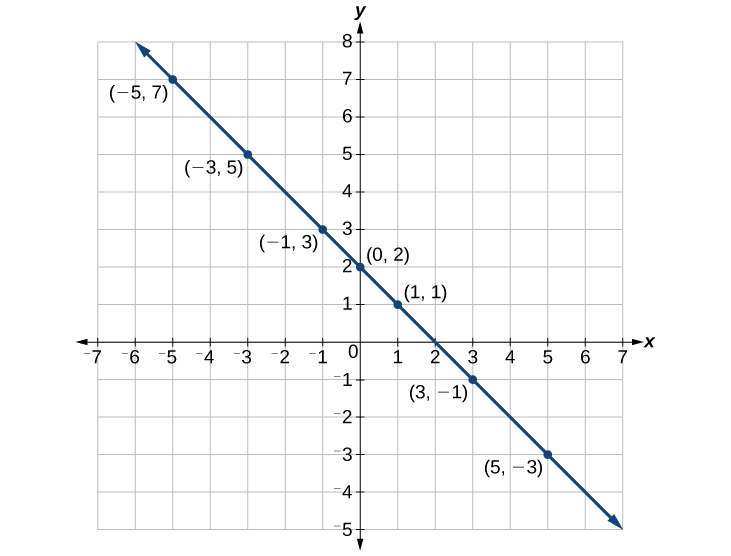
We can plot these points from the table. The points for this particular equation form a line, so we can connect them. This is not true for all equations.

Note that the x-values chosen are arbitrary regardless of the type of equation we are graphing. Of course, some situations may require particular values of x to be plotted in order to see a particular result. Otherwise, it is logical to choose values that can be calculated easily, and it is always a good idea to choose values that are both negative and positive. There is no rule dictating how many points to plot, although we need at least two to graph a line. Keep in mind, however, that the more points we plot, the more accurately we can sketch the graph.
How To: Given an equation, graph by plotting points
- Make a table with one column labeled x, a second column labeled with the equation, and a third column listing the resulting ordered pairs.
- Enter x-values down the first column using positive and negative values. Selecting the x-values in numerical order will make graphing easier.
- Select x-values that will yield y-values with little effort, preferably ones that can be calculated mentally.
- Plot the ordered pairs.
- Connect the points if they form a line.
Example: Graphing an Equation in Two Variables by Plotting Points
Graph the equation [latex]y=-x+2[/latex] by plotting points.
Try It
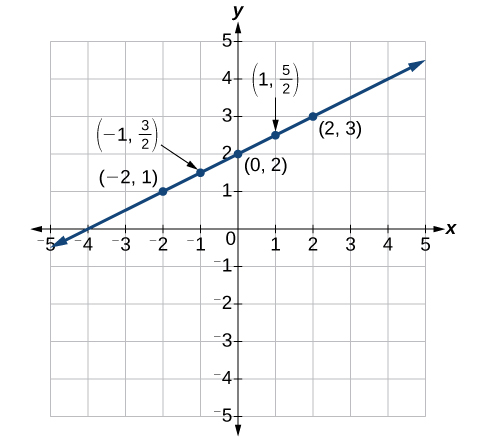
Construct a table and graph the equation by plotting points: [latex]y=\frac{1}{2}x+2[/latex].
https://www.myopenmath.com/multiembedq.php?id=110939&theme=oea&iframe_resize_id=mom3
Using Intercepts to Plot Lines in the Coordinate Plane
The intercepts of a graph are points where the graph crosses the axes. The x-intercept is the point where the graph crosses the x-axis. At this point, the y-coordinate is zero. The y-intercept is the point where the graph crosses the y-axis. At this point, the x-coordinate is zero.
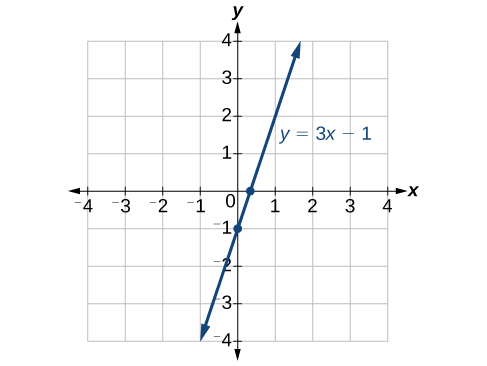
To determine the x-intercept, we set y equal to zero and solve for x. Similarly, to determine the y-intercept, we set x equal to zero and solve for y. For example, lets find the intercepts of the equation [latex]y=3x - 1[/latex].
To find the x-intercept, set [latex]y=0[/latex].
To find the y-intercept, set [latex]x=0[/latex].
We can confirm that our results make sense by observing a graph of the equation. Notice that the graph crosses the axes where we predicted it would.
How To: Given an equation, find the intercepts
- Find the x-intercept by setting [latex]y=0[/latex] and solving for [latex]x[/latex].
- Find the y-intercept by setting [latex]x=0[/latex] and solving for [latex]y[/latex].
Example: Finding the Intercepts of the Given Equation
Find the intercepts of the equation [latex]y=-3x - 4[/latex]. Then sketch the graph using only the intercepts.

Try It
Find the intercepts of the equation and sketch the graph: [latex]y=-\frac{3}{4}x+3[/latex].

https://www.myopenmath.com/multiembedq.php?id=92757&theme=oea&iframe_resize_id=mom4
Using a Graphing Utility to Plot Lines
https://www.desmos.com/calculator
https://www.mathway.com/Graph
https://www.symbolab.com/graphing-calculator
Try it now
These graphing utilities have features that allow you to turn a constant (number) into a variable. Follow these steps to learn how:
- Graph the line [latex]y=-\frac{2}{3}x-\frac{4}{3}[/latex].
- On the next line enter [latex]y=-a x-\frac{4}{3}[/latex]. You will see a button pop up that says “add slider: a”, click on the button. You will see the next line populated with the variable a and the interval on which a can take values.
- What part of a line does the variable a represent? The slope or the y-intercept?
The Distance Formula
Derived from the Pythagorean Theorem, the distance formula is used to find the distance between two points in the plane. The Pythagorean Theorem, [latex]{a}^{2}+{b}^{2}={c}^{2}[/latex], is based on a right triangle where a and b are the lengths of the legs adjacent to the right angle, and c is the length of the hypotenuse.
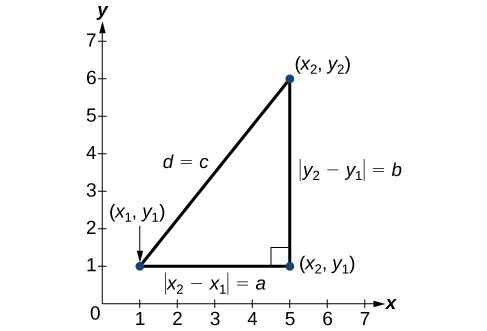
The relationship of sides [latex]|{x}_{2}-{x}_{1}|[/latex] and [latex]|{y}_{2}-{y}_{1}|[/latex] to side d is the same as that of sides a and b to side c. We use the absolute value symbol to indicate that the length is a positive number because the absolute value of any number is positive. (For example, [latex]|-3|=3[/latex]. ) The symbols [latex]|{x}_{2}-{x}_{1}|[/latex] and [latex]|{y}_{2}-{y}_{1}|[/latex] indicate that the lengths of the sides of the triangle are positive. To find the length c, take the square root of both sides of the Pythagorean Theorem.
It follows that the distance formula is given as
We do not have to use the absolute value symbols in this definition because any number squared is positive.
A General Note: The Distance Formula
Given endpoints [latex]\left({x}_{1},{y}_{1}\right)[/latex] and [latex]\left({x}_{2},{y}_{2}\right)[/latex], the distance between two points is given by
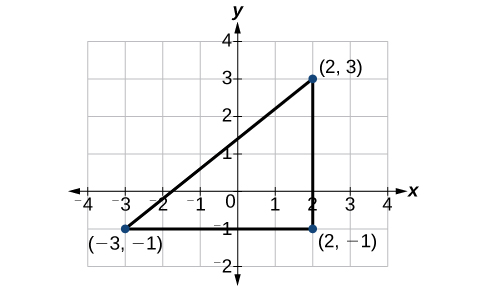
Example: Finding the Distance between Two Points
Find the distance between the points [latex]\left(-3,-1\right)[/latex] and [latex]\left(2,3\right)[/latex].
Try It
In the following video, we present more worked examples of how to use the distance formula to find the distance between two points in the coordinate plane.
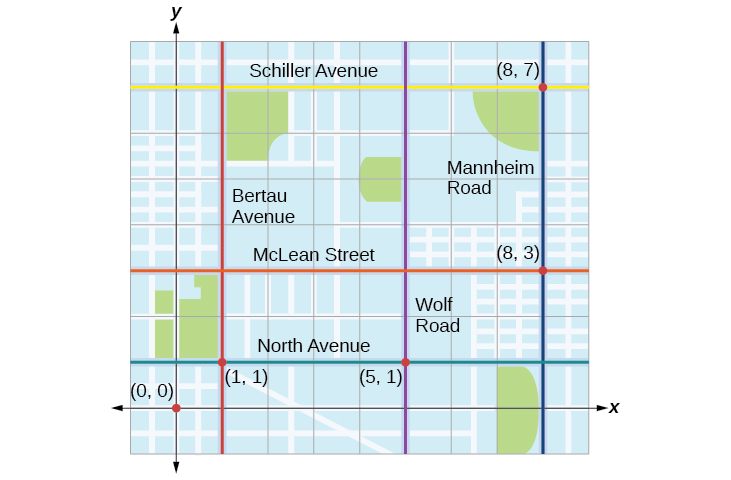
Example: Finding the Distance between Two Locations
Let’s return to the situation introduced at the beginning of this section.
Tracie set out from Elmhurst, IL to go to Franklin Park. On the way, she made a few stops to do errands. Each stop is indicated by a red dot. Find the total distance that Tracie traveled. Compare this with the distance between her starting and final positions.
Using the Midpoint Formula
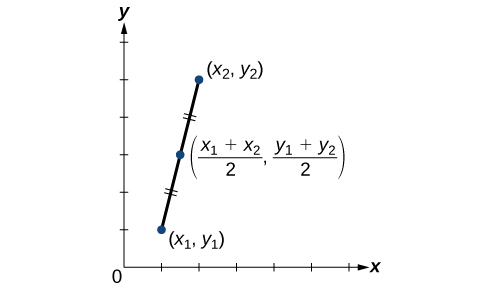
When the endpoints of a line segment are known, we can find the point midway between them. This point is known as the midpoint and the formula is known as the midpoint formula. Given the endpoints of a line segment, [latex]\left({x}_{1},{y}_{1}\right)[/latex] and [latex]\left({x}_{2},{y}_{2}\right)[/latex], the midpoint formula states how to find the coordinates of the midpoint [latex]M[/latex].
A graphical view of a midpoint is shown below. Notice that the line segments on either side of the midpoint are congruent.
Example: Finding the Midpoint of the Line Segment
Find the midpoint of the line segment with the endpoints [latex]\left(7,-2\right)[/latex] and [latex]\left(9,5\right)[/latex].
Try It
Find the midpoint of the line segment with endpoints [latex]\left(-2,-1\right)[/latex] and [latex]\left(-8,6\right)[/latex].
https://www.myopenmath.com/multiembedq.php?id=2308&theme=oea&iframe_resize_id=mom2
Section 1.1 Homework Exercises
1. Is it possible for a point plotted in the Cartesian coordinate system to not lie in one of the four quadrants? Explain.
2. Describe the process for finding the x-intercept and the y-intercept of a graph algebraically.
3. Describe in your own words what the y-intercept of a graph is.
4. When using the distance formula, [latex]d=\sqrt{{\left({x}_{2}-{x}_{1}\right)}^{2}+{\left({y}_{2}-{y}_{1}\right)}^{2}}[/latex], explain the correct order of operations that are to be performed to obtain the correct answer.
For each of the following exercises, find the x-intercept and the y-intercept without graphing. Write the coordinates of each intercept.
5. [latex]y=-3x+6[/latex]
6. [latex]4y=2x-1[/latex]
7. [latex]3x-2y=6[/latex]
8. [latex]4x-3=2y[/latex]
9. [latex]3x+8y=9[/latex]
10. [latex]2x-\frac{2}{3}=\frac{3}{4}y+3[/latex]
For each of the following exercises, solve the equation for [latex]y[/latex] in terms of [latex]x[/latex].
11. [latex]4x+2y=8[/latex]
12. [latex]3x-2y=6[/latex]
13. [latex]2x=5-3y[/latex]
14. [latex]x-2y=7[/latex]
15. [latex]5y+4=10x[/latex]
16. [latex]5x+2y=0[/latex]
For each of the following exercises, find the distance between the two points. Simplify your answers, and write the exact answer in simplest radical form for irrational answers.
17. [latex](-4,1)[/latex] and [latex](3,-4)[/latex]
18. [latex](2,-5)[/latex] and [latex](7,4)[/latex]
19. [latex](5,0)[/latex] and [latex](5,6)[/latex]
20. [latex](-4,3)[/latex] and [latex](10,3)[/latex]
21. Find the distance between the two points given your calculator, and round your answer to the nearest hundredth. [latex](19,12)[/latex] and [latex](41,71)[/latex]
For each of the following exercises, find the coordinates of the midpoint of the line segment that joins the two given points.
22. [latex](-5,6)[/latex] and [latex](4,2)[/latex]
23. [latex](-1,1)[/latex] and [latex](7,-4)[/latex]
24. [latex](-5,-3)[/latex] and [latex](-2,-8)[/latex]
25. [latex](0,7)[/latex] and [latex](4,-9)[/latex]
26. [latex](-43,17)[/latex] and [latex](23,-34)[/latex]
For each of the following exercises, identify the information requested.
27. What are the coordinates of the origin?
28. If a point is located on the y-axis, what is the x-coordinate?
29. If a point is located on the x-axis, what is the y-coordinate?
For each of the following exercises, plot the three points on the same coordinate plane. State whether the three points you plotted appear to be collinear (on the same line).
30. [latex](4,1),(-2,3),(5,0)[/latex]
31. [latex](-1,2),(0,4),(2,1)[/latex]
32. [latex](-3,0),(-3,4),(-3,-3)[/latex]
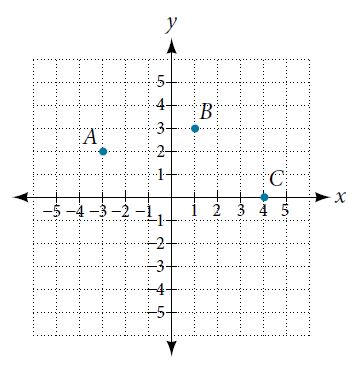
33. Name the coordinates of the points graphed below.
34. Name the quadrant in which the following points would be located. If the point is on an axis, name the axis.
a. [latex](-3,4)[/latex] b. [latex](-5,0)[/latex] c. [latex](1,-4)[/latex] d. [latex](-2,7)[/latex] e. [latex](0,-3)[/latex]
For the following exercises, construct a table and graph the equation by plotting at least three points.
35. [latex]y=\frac{1}{3}x+2[/latex]
36. [latex]y=-3x+1[/latex]
37. [latex]2y=x+3[/latex]
For each of the following exercises, find and plot the x- and y-intercepts, and graph the straight line based on those two points.
38. [latex]4x-3y=12[/latex]
39. [latex]x-2y=8[/latex]
40. [latex]y-5=5x[/latex]
41. [latex]3y=-2x+6[/latex]
42. [latex]y=\frac{x-3}{2}[/latex]
For questions 43 – 47, use the graph in the figure below.
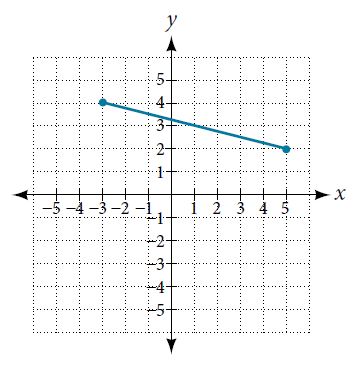
43. Find the distance between the two endpoints using the distance formula. Round to three decimal places.
44. Find the coordinates of the midpoint of the line segment connecting the two points.
45. Find the distance that [latex](-3,4)[/latex] is from the origin.
46. Find the distance that [latex](5,2)[/latex] is from the origin. Round to three decimal places.
47. Which point is closer to the origin?
48. A man drove 10 mi directly east from his home, made a left turn at an intersection, and then traveled 5 mi north to his place of work. If a road was made directly from his home to his place of work, what would its distance be to the nearest tenth of a mile?
49. If the road was made in the previous exercise, how much shorter would the man’s one way trip be everyday?
50. Given these four points [latex]A=(1,3),\text{ }B=(-3,5),\text{ }C=(4,7),\text{ }D=(5,-4)[/latex], find the coordinates of the midpoint of line segments [latex]\overline{AB}[/latex] and [latex]\overline{CD}[/latex].
51. After finding the two midpoints in the previous exercise, find the distance between the two midpoints to the nearest thousandth.
52. The coordinates on a map for San Francisco are [latex](53,17)[/latex] and those for Sacramento are [latex](123,78)[/latex]. Note that the coordinates represent miles. Find the distance between the cities to the nearest mile.
53. If San Jose’s coordinates are [latex](76,-12)[/latex], where the coordinates represent miles, find the distance between San Jose and San Francisco to the nearest mile.
54. A small craft in Lake Ontario sends out a distress signal. The coordinates of the boat in trouble were [latex](49,64)[/latex]. One rescue boat is at the coordinates [latex](60,82)[/latex] and a second Coast Guard craft is at coordinates [latex](58,47)[/latex]. Assuming both rescue craft travel at the same rate, which one would get to the distressed boat the fastest?
Candela Citations
- Revision and Adaptation. Provided by: Lumen Learning. License: CC BY: Attribution
- College Algebra. Authored by: Abramson, Jay et al.. Provided by: OpenStax. Located at: http://cnx.org/contents/9b08c294-057f-4201-9f48-5d6ad992740d@5.2. License: CC BY: Attribution. License Terms: Download for free at http://cnx.org/contents/9b08c294-057f-4201-9f48-5d6ad992740d@5.2
- Question ID 92752, 92753. Authored by: Michael Jenck. License: CC BY: Attribution. License Terms: IMathAS Community License, CC-BY + GPL
- Ex: Plotting Points on the Coordinate Plane. Authored by: James Sousa. Provided by: Mathispower4u. Located at: https://www.youtube.com/watch?v=7JMXi_FxA2o. License: CC BY-SA: Attribution-ShareAlike
- College Algebra. Authored by: OpenStax College Algebra. Provided by: OpenStax. Located at: http://cnx.org/contents/9b08c294-057f-4201-9f48-5d6ad992740d@3.278:1/Preface. License: CC BY: Attribution
- Learn Desmos: Points. Authored by: Desmos. Located at: https://youtu.be/eS6kabG2omI?list=PLfM6zMGnbgOGLZc-_Yj3QVK3Vz_L4Cw59. License: All Rights Reserved. License Terms: Standard YouTube License