Learning Outcomes
- Define the components of the Cartesian coordinate system.
- Plot points on the Cartesian coordinate plane.
- Plot linear equations in two variables on the coordinate plane.
- Use intercepts to plot lines.
- Use a graphing utility to graph a linear equation on a coordinate plane.
- Find the slope of a line passing through two points.
An old story describes how seventeenth-century philosopher/mathematician René Descartes invented the system that has become the foundation of algebra while sick in bed. According to the story, Descartes was staring at a fly crawling on the ceiling when he realized that he could describe the fly’s location in relation to the perpendicular lines formed by the adjacent walls of his room. He viewed the perpendicular lines as horizontal and vertical axes. Further, by dividing each axis into equal unit lengths, Descartes saw that it was possible to locate any object in a two-dimensional plane using just two numbers—the displacement from the horizontal axis and the displacement from the vertical axis.
While there is evidence that ideas similar to Descartes’ grid system existed centuries earlier, it was Descartes who introduced the components that comprise the Cartesian coordinate system, a grid system having perpendicular axes. Descartes named the horizontal axis the x-axis and the vertical axis the y-axis.
The Cartesian coordinate system, also called the rectangular coordinate system, is based on a two-dimensional plane consisting of the x-axis and the y-axis. Perpendicular to each other, the axes divide the plane into four sections. Each section is called a quadrant; the quadrants are numbered counterclockwise as shown in the figure below.
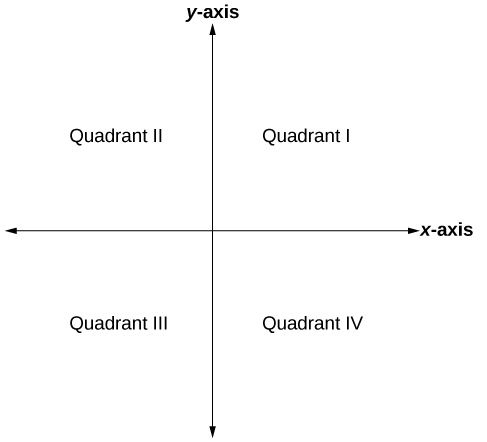
The Cartesian coordinate system with all four quadrants labeled.
Try It
The center of the plane is the point at which the two axes cross. It is known as the origin or point [latex]\left(0,0\right)[/latex]. From the origin, each axis is further divided into equal units: increasing, positive numbers to the right on the x-axis and up the y-axis; decreasing, negative numbers to the left on the x-axis and down the y-axis. The axes extend to positive and negative infinity as shown by the arrowheads in the figure below.
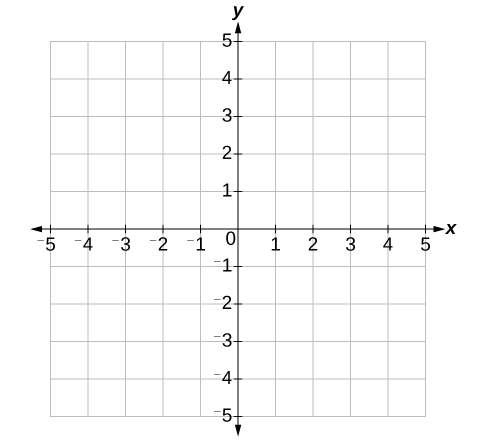
Each point in the plane is identified by its x-coordinate, or horizontal displacement from the origin, and its y-coordinate, or vertical displacement from the origin. Together we write them as an ordered pair indicating the combined distance from the origin in the form [latex]\left(x,y\right)[/latex]. An ordered pair is also known as a coordinate pair because it consists of x and y-coordinates. For example, we can represent the point [latex]\left(3,-1\right)[/latex] in the plane by moving three units to the right of the origin in the horizontal direction and one unit down in the vertical direction.
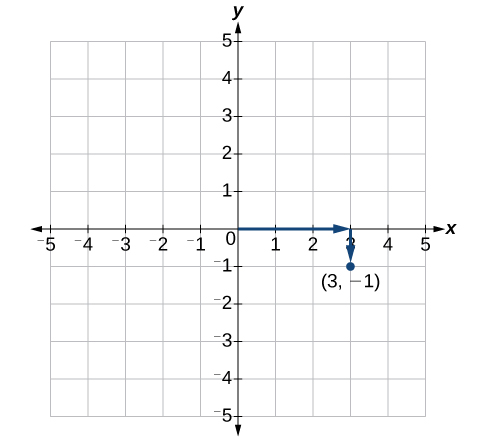
An illustration of how to plot the point (3,-1).
When dividing the axes into equally spaced increments, note that the x-axis may be considered separately from the y-axis. In other words, while the x-axis may be divided and labeled according to consecutive integers, the y-axis may be divided and labeled by increments of 2 or 10 or 100. In fact, the axes may represent other units such as years against the balance in a savings account or quantity against cost. Consider the rectangular coordinate system primarily as a method for showing the relationship between two quantities.
A General Note: Cartesian Coordinate System
A two-dimensional plane where the
- x-axis is the horizontal axis
- y-axis is the vertical axis
A point in the plane is defined as an ordered pair, [latex]\left(x,y\right)[/latex], such that x is determined by its horizontal distance from the origin and y is determined by its vertical distance from the origin.
Example: Plotting Points in a Rectangular Coordinate System
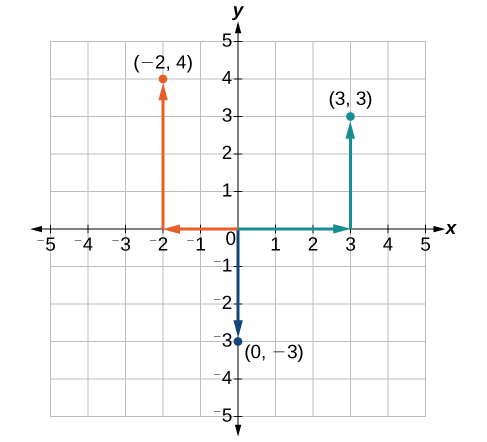
Plot the points [latex]\left(-2,4\right)[/latex], [latex]\left(3,3\right)[/latex], and [latex]\left(0,-3\right)[/latex] in the coordinate plane.
Try It
Graphing Linear Equations by Using a Table
We can plot a set of points to represent an equation. When such an equation contains both an x variable and a y variable, it is called an equation in two variables. Its graph is called a graph in two variables. Any graph on a two-dimensional plane is a graph in two variables.
Suppose we want to graph the equation [latex]y=2x - 1[/latex]. We can begin by substituting a value for x into the equation and determining the resulting value of y. Each pair of x and y-values is an ordered pair that can be plotted. The table below lists values of x from –3 to 3 and the resulting values for y.
| [latex]x[/latex] | [latex]y=2x - 1[/latex] | [latex]\left(x,y\right)[/latex] |
| [latex]-3[/latex] | [latex]y=2\left(-3\right)-1=-7[/latex] | [latex]\left(-3,-7\right)[/latex] |
| [latex]-2[/latex] | [latex]y=2\left(-2\right)-1=-5[/latex] | [latex]\left(-2,-5\right)[/latex] |
| [latex]-1[/latex] | [latex]y=2\left(-1\right)-1=-3[/latex] | [latex]\left(-1,-3\right)[/latex] |
| [latex]0[/latex] | [latex]y=2\left(0\right)-1=-1[/latex] | [latex]\left(0,-1\right)[/latex] |
| [latex]1[/latex] | [latex]y=2\left(1\right)-1=1[/latex] | [latex]\left(1,1\right)[/latex] |
| [latex]2[/latex] | [latex]y=2\left(2\right)-1=3[/latex] | [latex]\left(2,3\right)[/latex] |
| [latex]3[/latex] | [latex]y=2\left(3\right)-1=5[/latex] | [latex]\left(3,5\right)[/latex] |
We can plot these points from the table. The points for this particular equation form a line, so we can connect them. This is not true for all equations.

Note that the x-values chosen are arbitrary regardless of the type of equation we are graphing. Of course, some situations may require particular values of x to be plotted in order to see a particular result. Otherwise, it is logical to choose values that can be calculated easily, and it is always a good idea to choose values that are both negative and positive. There is no rule dictating how many points to plot, although we need at least two to graph a line. Keep in mind, however, that the more points we plot, the more accurately we can sketch the graph.
How To: Given an equation, graph by plotting points
- Make a table with one column labeled x, a second column labeled with the equation, and a third column listing the resulting ordered pairs.
- Enter x-values down the first column using positive and negative values. Selecting the x-values in numerical order will make graphing easier.
- Select x-values that will yield y-values with little effort, preferably ones that can be calculated mentally.
- Plot the ordered pairs.
- Connect the points if they form a line.
Example: Graphing an Equation in Two Variables by Plotting Points
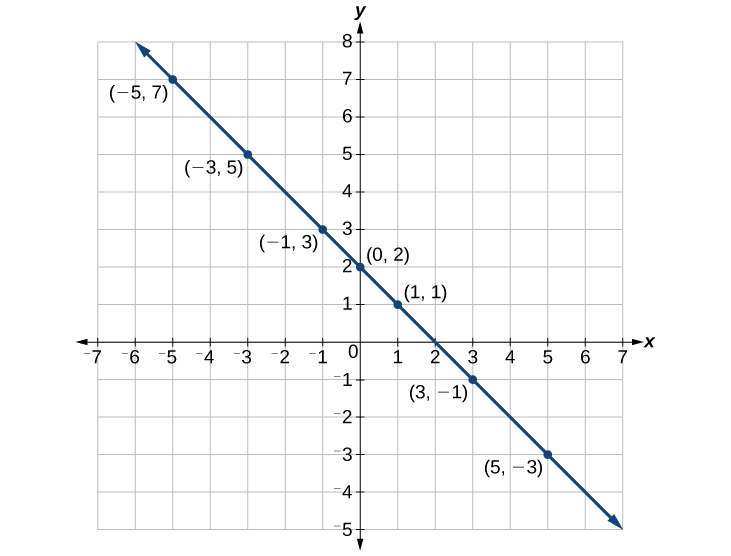
Graph the equation [latex]y=-x+2[/latex] by plotting points.
Try It
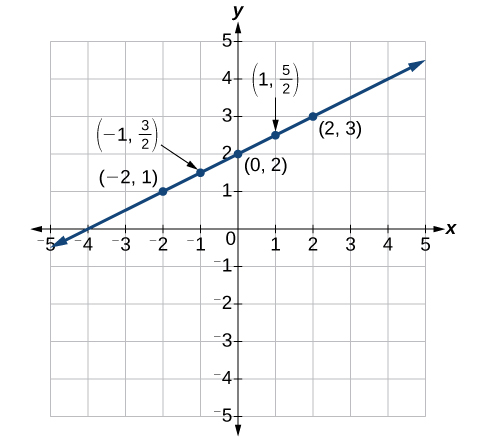
Construct a table and graph the equation by plotting points: [latex]y=\frac{1}{2}x+2[/latex].
Using Intercepts to Plot Lines in the Coordinate Plane
The intercepts of a graph are points where the graph crosses the axes. The x-intercept is the point where the graph crosses the x-axis. At this point, the y-coordinate is zero. The y-intercept is the point where the graph crosses the y-axis. At this point, the x-coordinate is zero.
To determine the x-intercept, we set y equal to zero and solve for x. Similarly, to determine the y-intercept, we set x equal to zero and solve for y. For example, lets find the intercepts of the equation [latex]y=3x - 1[/latex].
To find the x-intercept, set [latex]y=0[/latex].
To find the y-intercept, set [latex]x=0[/latex].
We can confirm that our results make sense by observing a graph of the equation. Notice that the graph crosses the axes where we predicted it would.

How To: Given an equation, find the intercepts
- Find the x-intercept by setting [latex]y=0[/latex] and solving for [latex]x[/latex].
- Find the y-intercept by setting [latex]x=0[/latex] and solving for [latex]y[/latex].
Example: Finding the Intercepts of the Given Equation
Find the intercepts of the equation [latex]y=-3x - 4[/latex]. Then sketch the graph using only the intercepts.
Try It
Find the intercepts of the equation and sketch the graph: [latex]y=-\frac{3}{4}x+3[/latex].
Using a Graphing Utility to Plot Lines
https://www.desmos.com/calculator
https://www.mathway.com/Graph
https://www.symbolab.com/graphing-calculator
Try it now
These graphing utilities have features that allow you to turn a constant (number) into a variable. Follow these steps to learn how:
- Graph the line [latex]y=-\frac{2}{3}x-\frac{4}{3}[/latex].
- On the next line enter [latex]y=-a x-\frac{4}{3}[/latex]. You will see a button pop up that says “add slider: a”, click on the button. You will see the next line populated with the variable a and the interval on which a can take values.
- What part of a line does the variable a represent? The slope or the y-intercept?
The Slope of a Line
The slope of a line refers to the ratio of the vertical change in y over the horizontal change in x between any two points on a line. It indicates the direction in which a line slants as well as its steepness. Slope is sometimes described as rise over run.
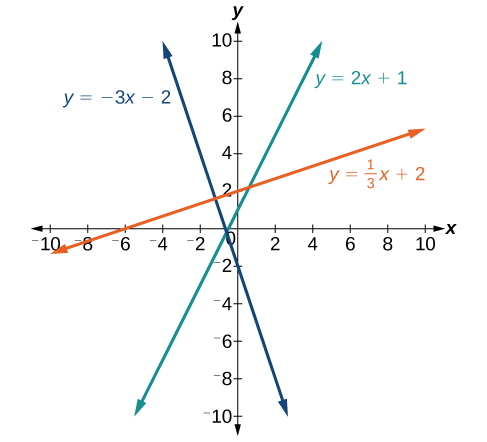
If the slope is positive, the line slants upward to the right. If the slope is negative, the line slants downward to the right. As the slope increases, the line becomes steeper. Some examples are shown below. The lines indicate the following slopes: [latex]m=-3[/latex], [latex]m=2[/latex], and [latex]m=\frac{1}{3}[/latex].
A General Note: The Slope of a Line
The slope of a line, m, represents the change in y over the change in x. Given two points, [latex]\left({x}_{1},{y}_{1}\right)[/latex] and [latex]\left({x}_{2},{y}_{2}\right)[/latex], the following formula determines the slope of a line containing these points:
Example: Finding the Slope of a Line Given Two Points
Find the slope of a line that passes through the points [latex]\left(2,-1\right)[/latex] and [latex]\left(-5,3\right)[/latex].
Try It
Find the slope of the line that passes through the points [latex]\left(-2,6\right)[/latex] and [latex]\left(1,4\right)[/latex].
