Learning Outcomes
- Find x- and y-intercepts.
- Use intercepts to plot lines.
- Test for x-axis, y-axis, and origin symmetry.
Using Intercepts to Plot Lines in the Coordinate Plane
The intercepts of a graph are points where the graph crosses the axes. The x-intercept is the point where the graph crosses the x-axis. At this point, the y-coordinate is zero. The y-intercept is the point where the graph crosses the y-axis. At this point, the x-coordinate is zero.
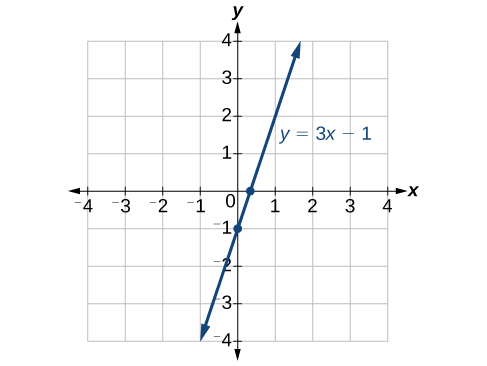
To determine the x-intercept, we set y equal to zero and solve for x. Similarly, to determine the y-intercept, we set x equal to zero and solve for y. For example, lets find the intercepts of the equation [latex]y=3x - 1[/latex].
To find the x-intercept, set [latex]y=0[/latex].
To find the y-intercept, set [latex]x=0[/latex].
We can confirm that our results make sense by observing a graph of the equation. Notice that the graph crosses the axes where we predicted it would.
How To: Given an equation, find the intercepts
- Find the x-intercept by setting [latex]y=0[/latex] and solving for [latex]x[/latex].
- Find the y-intercept by setting [latex]x=0[/latex] and solving for [latex]y[/latex].
Example: Finding the Intercepts of the Given Equation
Find the intercepts of the equation [latex]y=-3x - 4[/latex]. Then sketch the graph using only the intercepts.

Try It
Find the intercepts of the equation and sketch the graph: [latex]y=-\frac{3}{4}x+3[/latex].

Try It
Symmetry
Think of symmetry as a fold line. If a graph can be folded on top of itself and everything overlaps, then it has symmetry. The fold line that allows this to happen is called the line of symmetry.
Symmetry
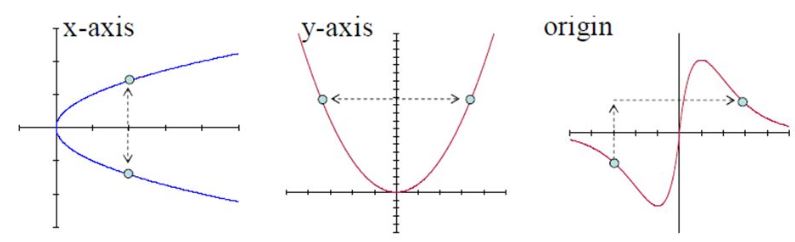
Below are the three types of symmetry:
How To: test for symmetry without graphing
- x-axis symmetry: Replace y by -y in the original equation. If it simplifies to the original equation it has this symmetry.
- y-axis symmetry: Replace x by -x in the original equation. If it simplifies to the original equation it has this symmetry.
- origin symmetry: Replace y by -y and x by -x in the original equation. If it simplifies to the original equation it has this symmetry.
Example 9: Testing for Symmetry Algebraically
Test the following equation for symmetry: [latex]y^2=3x-4[/latex]
Try It
Test the following equation for symmetry: [latex]y=2x^3-x[/latex].
Section 1.2 Homework Exercises
For each of the following exercises, find the x-intercept and the y-intercept without graphing. Write the coordinates of each intercept.
1. [latex]y=-3x+6[/latex]
2. [latex]4y=2x-1[/latex]
3. [latex]3x-2y=6[/latex]
4. [latex]4x-3=2y[/latex]
5. [latex]3x+8y=9[/latex]
6. [latex]2x-\frac{2}{3}=\frac{3}{4}y+3[/latex]
For each of the following exercises, find and plot the x- and y-intercepts, and graph the straight line based on those two points.
7. [latex]x-2y=8[/latex]
8. [latex]y-5=5x[/latex]
9. [latex]3y=-2x+6[/latex]
10. [latex]y=\frac{x-3}{2}[/latex]
For the following exercises, test for symmetry.
11. [latex]y=x^2+12[/latex]
12. [latex]x=y^2+1[/latex]
13. [latex]x=y^2-5[/latex]
14. [latex]y^2=x^2+4[/latex]
15. [latex]y^2=x^2-7[/latex]
16. [latex]x^2+y^3=3[/latex]
17. [latex]x^3-y^2=11[/latex]
18. [latex]y=2x-3[/latex]