Learning Outcomes
- Build linear models from verbal descriptions.
- Build nonlinear models from verbal descriptions.
- Solve linear and nonlinear models.
Modeling Real-World Problems with Linear Functions
In the real world, problems are not always explicitly stated in terms of a function or represented with a graph. Fortunately, we can analyze the problem by first representing it as a linear function and then interpreting the components of the function. As long as we know, or can figure out, the initial value and the rate of change of a linear function, we can solve many different kinds of real-world problems.
How To: Given a linear function f and the initial value and rate of change, evaluate f(c).
- Determine the initial value and the rate of change (slope).
- Substitute the values into [latex]f\left(x\right)=mx+b[/latex].
- Evaluate the function at [latex]x=c[/latex].
Example 1: Using a Linear Function to Determine the Number of Songs in a Music Collection
Marcus currently has 200 songs in his music collection. Every month, he adds 15 new songs. Write a formula for the number of songs, N, in his collection as a function of time, t, the number of months. How many songs will he own in a year?

Example 2: Using a Linear Function to Calculate Salary Plus Commission
Working as an insurance salesperson, Ilya earns a base salary plus a commission on each new policy. Therefore, Ilya’s weekly income, I, depends on the number of new policies, n, he sells during the week. Last week he sold 3 new policies, and earned $760 for the week. The week before, he sold 5 new policies and earned $920. Find an equation for I(n), and interpret the meaning of the components of the equation.
Example 3: Using Tabular Form to Write an Equation for a Linear Function
The table below relates the number of rats in a population to time, in weeks. Use the table to write a linear equation.
| w, number of weeks | 0 | 2 | 4 | 6 |
| P(w), number of rats | 1000 | 1080 | 1160 | 1240 |
Q & A
Is the initial value always provided in a table of values like the table in Example 12?
No. Sometimes the initial value is provided in a table of values, but sometimes it is not. If you see an input of 0, then the initial value would be the corresponding output. If the initial value is not provided because there is no value of input on the table equal to 0, find the slope, substitute one coordinate pair and the slope into [latex]f\left(x\right)=mx+b[/latex], and solve for b.
Try It
A new plant food was introduced to a young tree to test its effect on the height of the tree. The table below shows the height of the tree, in feet, x months since the measurements began. Write a linear function, H(x), where x is the number of months since the start of the experiment.
| x | 0 | 2 | 4 | 8 | 12 |
| H(x) | 12.5 | 13.5 | 14.5 | 16.5 | 18.5 |
Identifying Steps to Model and Solve Problems
When modeling scenarios with linear or nonlinear functions and solving problems, we follow the below strategies. Let’s briefly review them:
- Identify changing quantities, and then define descriptive variables to represent those quantities. When appropriate, sketch a picture or define a coordinate system.
- Carefully read the problem to identify important information. Look for information that provides values for the variables or values for parts of the functional model, such as slope and initial value.
- Carefully read the problem to determine what we are trying to find, identify, solve, or interpret.
- Identify a solution pathway from the provided information to what we are trying to find. Often this will involve checking and tracking units, building a table, or even finding a formula for the function being used to model the problem.
- When needed, write a formula for the function.
- Solve or evaluate the function using the formula.
- Reflect on whether your answer is reasonable for the given situation and whether it makes sense mathematically.
- Clearly convey your result using appropriate units, and answer in full sentences when necessary.
Building Linear Models
Now let’s take a look at the student in Seattle. In her situation, there are two changing quantities: time and money. The amount of money she has remaining while on vacation depends on how long she stays. We can use this information to define our variables, including units.
- Output: M, money remaining, in dollars
- Input: t, time, in weeks
So, the amount of money remaining depends on the number of weeks: M(t)
We can also identify the initial value and the rate of change.
- Initial Value: She saved $3,500, so $3,500 is the initial value for M.
- Rate of Change: She anticipates spending $400 each week, so –$400 per week is the rate of change, or slope.
Notice that the unit of dollars per week matches the unit of our output variable divided by our input variable. Also, because the slope is negative, the linear function is decreasing. This should make sense because she is spending money each week.

Figure 2
The rate of change is constant, so we can start with the linear model [latex]M\left(t\right)=mt+b[/latex]. Then we can substitute the intercept and slope provided.
To find the x-intercept, we set the output to zero, and solve for the input.
The x-intercept is 8.75 weeks. Because this represents the input value when the output will be zero, we could say that Emily will have no money left after 8.75 weeks.
When modeling any real-life scenario with functions, there is typically a limited domain over which that model will be valid—almost no trend continues indefinitely. Here the domain refers to the number of weeks. In this case, it doesn’t make sense to talk about input values less than zero. A negative input value could refer to a number of weeks before she saved $3,500, but the scenario discussed poses the question once she saved $3,500 because this is when her trip and subsequent spending starts. It is also likely that this model is not valid after the x-intercept, unless Emily will use a credit card and goes into debt. The domain represents the set of input values, so the reasonable domain for this function is [latex]0\le t\le 8.75[/latex].
In the above example, we were given a written description of the situation. We followed the steps of modeling a problem to analyze the information. However, the information provided may not always be the same. Sometimes we might be provided with an intercept. Other times we might be provided with an output value. We must be careful to analyze the information we are given, and use it appropriately to build a linear model.
Using a Given Intercept to Build a Model
Some real-world problems provide the y-intercept, which is the constant or initial value. Once the y-intercept is known, the x-intercept can be calculated. Suppose, for example, that Hannah plans to pay off a no-interest loan from her parents. Her loan balance is $1,000. She plans to pay $250 per month until her balance is $0. The y-intercept is the initial amount of her debt, or $1,000. The rate of change, or slope, is–$250 per month. We can then use the slope-intercept form and the given information to develop a linear model.
Now we can set the function equal to 0, and solve for x to find the x-intercept.
The x-intercept is the number of months it takes her to reach a balance of $0. The x-intercept is 4 months, so it will take Hannah four months to pay off her loan.
Using a Given Input and Output to Build a Model
Many real-world applications are not as direct as the ones we just considered. Instead they require us to identify some aspect of a linear function. We might sometimes instead be asked to evaluate the linear model at a given input or set the equation of the linear model equal to a specified output.
How To: Given a word problem that includes two pairs of input and output values, use the linear function to solve a problem.
- Identify the input and output values.
- Convert the data to two coordinate pairs.
- Find the slope.
- Write the linear model.
- Use the model to make a prediction by evaluating the function at a given x value.
- Use the model to identify an x value that results in a given y value.
- Answer the question posed.
Example 4: Using a Linear Model to Investigate a Town’s Population
A town’s population has been growing linearly. In 2004 the population was 6,200. By 2009 the population had grown to 8,100. Assume this trend continues.
- Predict the population in 2013.
- Identify the year in which the population will reach 15,000.
Try It
A company sells doughnuts. They incur a fixed cost of $25,000 for rent, insurance, and other expenses. It costs $0.25 to produce each doughnut.
- Write a linear model to represent the cost C of the company as a function of x, the number of doughnuts produced.
- Find and interpret the y-intercept.
Try It
A city’s population has been growing linearly. In 2008, the population was 28,200. By 2012, the population was 36,800. Assume this trend continues.
- Predict the population in 2014.
- Identify the year in which the population will reach 54,000.
Try It
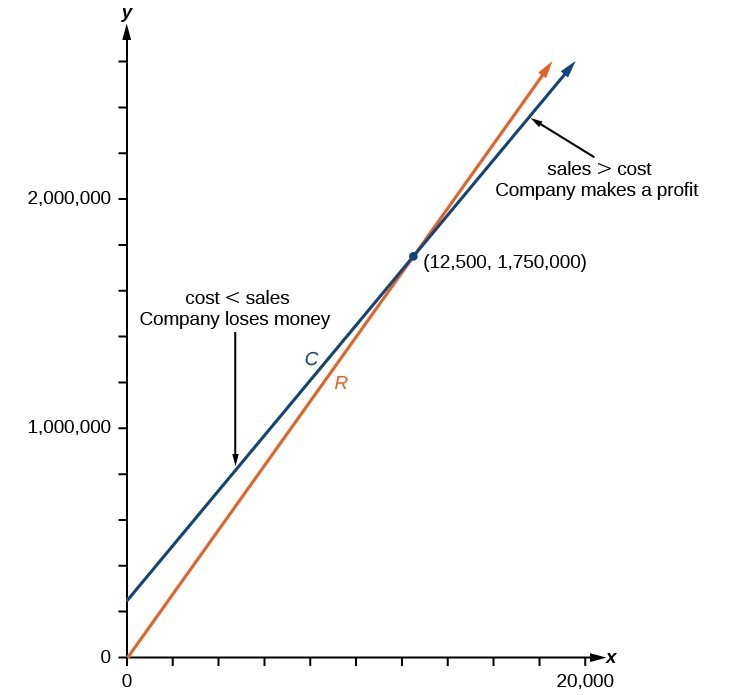
Example 5: Finding a Break-Even Point
A company sells sports helmets. The company incurs a one-time fixed cost for $250,000. Each helmet costs $120 to produce, and sells for $140.
- Find the cost function, C, to produce x helmets, in dollars.
- Find the revenue function, R, from the sales of x helmets, in dollars.
- Find the break-even point, the point of intersection of the two graphs C and R.
Example 6: Express the area as a function of x
A rectangle has one corner in quadrant I on the graph of [latex]y=9-x^2[/latex], another at the origin, a third on the positive y-axis, and the fourth on the positive x-axis. Express the area A of the rectangle as a function of x. See figure 4 below.

Figure 4
Section 2.6 Homework Exercises
1. Explain how to find the input variable in a word problem that uses a linear function.
2. Explain how to find the output variable in a word problem that uses a linear function.
3. Explain how to interpret the initial value in a word problem that uses a linear function.
4. Explain how to determine the slope in a word problem that uses a linear function.
5. A gym membership with two personal training sessions costs $125, while gym membership with five personal training sessions costs $260. What is cost per session?
6. A clothing business finds there is a linear relationship between the number of shirts, n, it can sell and the price, p, it can charge per shirt. In particular, historical data shows that 1,000 shirts can be sold at a price of $30, while 3,000 shirts can be sold at a price of $22. Find a linear equation in the form [latex]p\left(n\right)=mn+b[/latex] that gives the price p they can charge for n shirts.
7. A phone company charges for service according to the formula: [latex]C\left(n\right)=24+0.1n[/latex], where n is the number of minutes talked, and [latex]C\left(n\right)[/latex] is the monthly charge, in dollars. Find and interpret the rate of change and initial value.
8. A farmer finds there is a linear relationship between the number of bean stalks, n, she plants and the yield, y, each plant produces. When she plants 30 stalks, each plant yields 30 oz of beans. When she plants 34 stalks, each plant produces 28 oz of beans. Find a linear relationships in the form [latex]y=\mathrm{mn}+b[/latex] that gives the yield when n stalks are planted.
9. A city’s population in the year 1960 was 287,500. In 1989 the population was 275,900. Compute the rate of growth of the population and make a statement about the population rate of change in people per year.
10. A town’s population has been growing linearly. In 2003, the population was 45,000, and the population has been growing by 1,700 people each year. Write an equation, [latex]P\left(t\right)[/latex], for the population t years after 2003.
11. Suppose that average annual income (in dollars) for the years 1990 through 1999 is given by the linear function: [latex]I\left(x\right)=1054x+23,286[/latex], where x is the number of years after 1990. Which of the following interprets the slope in the context of the problem?
a. As of 1990, average annual income was $23,286.
b. In the ten-year period from 1990–1999, average annual income increased by a total of $1,054.
c. Each year in the decade of the 1990s, average annual income increased by $1,054.
d. Average annual income rose to a level of $23,286 by the end of 1999.
12. When temperature is 0 degrees Celsius, the Fahrenheit temperature is 32. When the Celsius temperature is 100, the corresponding Fahrenheit temperature is 212. Express the Fahrenheit temperature as a linear function of C, the Celsius temperature, [latex]F\left(C\right)[/latex].
a. Find the rate of change of Fahrenheit temperature for each unit change temperature of Celsius.
b. Find and interpret [latex]F\left(28\right)[/latex].
c. Find and interpret [latex]F\left(-40\right)[/latex].
For the following exercises, consider this scenario: A town’s population has been decreasing at a constant rate. In 2010 the population was 5,900. By 2012 the population had dropped 4,700. Assume this trend continues.
13. Predict the population in 2016.
14. Identify the year in which the population will reach 0.
For the following exercises, consider this scenario: A town’s population has been increased at a constant rate. In 2010 the population was 46,020. By 2012 the population had increased to 52,070. Assume this trend continues.
15. Predict the population in 2016.
16. Identify the year in which the population will reach 75,000.
For the following exercises, consider this scenario: A town has an initial population of 75,000. It grows at a constant rate of 2,500 per year for 5 years.
17. Find the linear function that models the town’s population P as a function of the year, t, where t is the number of years since the model began.
18. Find a reasonable domain and range for the function P.
19. If the function P is graphed, find and interpret the x- and y-intercepts.
20. If the function P is graphed, find and interpret the slope of the function.
21. When will the output reached 100,000?
22. What is the output in the year 12 years from the onset of the model?
For the following exercises, consider this scenario: The weight of a newborn is 7.5 pounds. The baby gained one-half pound a month for its first year.
23. Find the linear function that models the baby’s weight W as a function of the age of the baby, in months, t.
24. Find a reasonable domain and range for the function W.
25. If the function W is graphed, find and interpret the x– and y-intercepts.
26. If the function W is graphed, find and interpret the slope of the function.
27. When did the baby weight 10.4 pounds?
28. What is the output when the input is 6.2? Interpret your answer.
For the following exercises, consider this scenario: The number of people afflicted with the common cold in the winter months steadily decreased by 205 each year from 2005 until 2010. In 2005, 12,025 people were afflicted.
29. Find the linear function that models the number of people inflicted with the common cold C as a function of the year, t.
30. Find a reasonable domain and range for the function C.
31. If the function C is graphed, find and interpret the x– and y-intercepts.
32. If the function C is graphed, find and interpret the slope of the function.
33. When will the output reach 0?
34. In what year will the number of people be 9,700?
For the following exercises, use the graph below, which shows the profit, y, in thousands of dollars, of a company in a given year, t, where t represents the number of years since 1980.
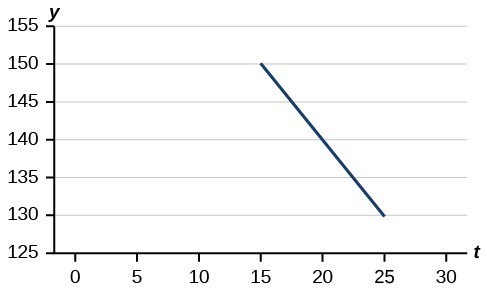
35. Find the linear function y, where y depends on t, the number of years since 1980.
36. Find and interpret the y-intercept.
37. Find and interpret the x-intercept.
38. Find and interpret the slope.
For the following exercises, use the graph in below, which shows the profit, y, in thousands of dollars, of a company in a given year, t, where t represents the number of years since 1980.
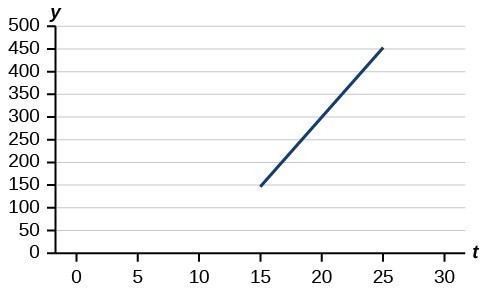
39. Find the linear function y, where y depends on t, the number of years since 1980.
40. Find and interpret the y-intercept.
41. Find and interpret the x-intercept.
42. Find and interpret the slope.
For the following exercises, use the median home values in Mississippi and Hawaii (adjusted for inflation) shown below. Assume that the house values are changing linearly.
| Year | Mississippi | Hawaii |
|---|---|---|
| 1950 | $25,200 | $74,400 |
| 2000 | $71,400 | $272,700 |
43. In which state have home values increased at a higher rate?
44. If these trends were to continue, what would be the median home value in Mississippi in 2010?
45. If we assume the linear trend existed before 1950 and continues after 2000, the two states’ median house values will be (or were) equal in what year? (The answer might be absurd.)
For the following exercises, use the median home values in Indiana and Alabama (adjusted for inflation) shown below. Assume that the house values are changing linearly.
| Year | Indiana | Alabama |
|---|---|---|
| 1950 | $37,700 | $27,100 |
| 2000 | $94,300 | $85,100 |
46. In which state have home values increased at a higher rate?
47. If these trends were to continue, what would be the median home value in Indiana in 2010?
48. If we assume the linear trend existed before 1950 and continues after 2000, the two states’ median house values will be (or were) equal in what year? (The answer might be absurd.)
49. In 2004, a school population was 1001. By 2008 the population had grown to 1697. Assume the population is changing linearly.
a. How much did the population grow between the year 2004 and 2008?
b. How long did it take the population to grow from 1001 students to 1697 students?
c. What is the average population growth per year?
d. What was the population in the year 2000?
e. Find an equation for the population, P, of the school t years after 2000.
f. Using your equation, predict the population of the school in 2011.
50. In 2003, a town’s population was 1,431. By 2007 the population had grown to 2,134. Assume the population is changing linearly.
a. How much did the population grow between the year 2003 and 2007?
b. How long did it take the population to grow from 1,431 people to 2,134 people?
c. What is the average population growth per year?
d. What was the population in the year 2000?
e. Find an equation for the population, P of the town t years after 2000.
f. Using your equation, predict the population of the town in 2014.
51. A phone company has a monthly cellular plan where a customer pays a flat monthly fee and then a certain amount of money per minute used on the phone. If a customer uses 410 minutes, the monthly cost will be $71.50. If the customer uses 720 minutes, the monthly cost will be $118.
a. Find a linear equation for the monthly cost of the cell plan as a function of x, the number of monthly minutes used.
b. Interpret the slope and y-intercept of the equation.
c. Use your equation to find the total monthly cost if 687 minutes are used.
52. A phone company has a monthly cellular data plan where a customer pays a flat monthly fee of $10 and then a certain amount of money per megabyte (MB) of data used on the phone. If a customer uses 20 MB, the monthly cost will be $11.20. If the customer uses 130 MB, the monthly cost will be $17.80.
a. Find a linear equation for the monthly cost of the data plan as a function of x, the number of MB used.
b. Interpret the slope and y-intercept of the equation.
c. Use your equation to find the total monthly cost if 250 MB are used.
53. In 1991, the moose population in a park was measured to be 4,360. By 1999, the population was measured again to be 5,880. Assume the population continues to change linearly.
a. Find a formula for the moose population, P since 1990.
b. What does your model predict the moose population to be in 2003?
54. In 2003, the owl population in a park was measured to be 340. By 2007, the population was measured again to be 285. The population changes linearly. Let the input be years since 1990.
a. Find a formula for the owl population, P. Let the input be years since 2003.
b. What does your model predict the owl population to be in 2012?
55. The Federal Helium Reserve held about 16 billion cubic feet of helium in 2010 and is being depleted by about 2.1 billion cubic feet each year.
a. Give a linear equation for the remaining federal helium reserves, R, in terms of t, the number of years since 2010.
b. In 2015, what will the helium reserves be?
c. If the rate of depletion doesn’t change, in what year will the Federal Helium Reserve be depleted?
56. Suppose the world’s oil reserves in 2014 are 1,820 billion barrels. If, on average, the total reserves are decreasing by 25 billion barrels of oil each year:
a. Give a linear equation for the remaining oil reserves, R, in terms of t the number of years since now.
b. Seven years from now, what will the oil reserves be?
c. If the rate at which the reserves are decreasing is constant, when will the world’s oil reserves be depleted?
57. You are choosing between two different prepaid cell phone plans. The first plan charges a rate of 26 cents per minute. The second plan charges a monthly fee of $19.95 plus 11 cents per minute. How many minutes would you have to use in a month in order for the second plan to be preferable?
58. You are choosing between two different window washing companies. The first charges $5 per window. The second charges a base fee of $40 plus $3 per window. How many windows would you need to have for the second company to be preferable?
59. When hired at a new job selling jewelry, you are given two pay options:
Option A: Base salary of $17,000 a year with a commission of 12% of your sales
Option B: Base salary of $20,000 a year with a commission of 5% of your sales
How much jewelry would you need to sell for option A to produce a larger income?
60. When hired at a new job selling electronics, you are given two pay options:
Option A: Base salary of $14,000 a year with a commission of 10% of your sales
Option B: Base salary of $19,000 a year with a commission of 4% of your sales
How much electronics would you need to sell for option A to produce a larger income?
61. When hired at a new job selling electronics, you are given two pay options:
Option A: Base salary of $20,000 a year with a commission of 12% of your sales
Option B: Base salary of $26,000 a year with a commission of 3% of your sales
How much electronics would you need to sell for option A to produce a larger income?
62. When hired at a new job selling electronics, you are given two pay options:
Option A: Base salary of $10,000 a year with a commission of 9% of your sales
Option B: Base salary of $20,000 a year with a commission of 4% of your sales
How much electronics would you need to sell for option A to produce a larger income?
63. A right triangle has one vertex on the graph of [latex]y=16-x^2[/latex], [latex]x>0[/latex], at [latex](x,y)[/latex], another at the origin, and a third on the positive x-axis at [latex](x,0)[/latex]. Express the area A of the triangle as a function of x.
64. A right triangle has one vertex on the graph of [latex]y=4-x^2[/latex], [latex]x>0[/latex], at [latex](x,y)[/latex], another at the origin, and a third on the positive x-axis at [latex](x,0)[/latex]. Express the area A of the triangle as a function of x.
65. A rectangle has one corner in quadrant I on the graph of [latex]y=16-x^2[/latex], another at the origin, a third on the positive y-axis, and the fourth on the positive x-axis. Express the area A of the rectangle as a function of x.
66. A rectangle has one corner in quadrant I on the graph of [latex]y=4-x^2[/latex], another at the origin, a third on the positive y-axis, and the fourth on the positive x-axis. Express the area A of the rectangle as a function of x.
67. A rectangle is inscribed in a semicircle of radius 2, in which [latex]y=\sqrt{4-x^2}[/latex]. Let [latex]P=(x,y)[/latex] be the point in quadrant I that is a vertex of the rectangle and is on the circle. Express the area A of the rectangle as a function of x. Then express the perimeter of the rectangle as a function of x.
68. A rectangle is inscribed in a semicircle of radius 2, in which [latex]y=\sqrt{9-x^2}[/latex]. Let [latex]P=(x,y)[/latex] be the point in quadrant I that is a vertex of the rectangle and is on the circle. Express the area A of the rectangle as a function of x. Then express the perimeter of the rectangle as a function of x.
69. A wire 10 meters long is to be cut into two pieces. Once piece will be shaped as a square, and the other piece will be shaped as a circle. Express the total area A enclosed by the pieces of wire as a function of the length x of a side of the square.
70. A wire 10 meters long is to be cut into two pieces. Once piece will be shaped as an equilateral triangle, and the other piece will be shaped as a circle. Express the total area A enclosed by the pieces of wire as a function of the length x of a side of the equilateral triangle.
71. A semicircle of radius r is inscribed in a rectangle so that the diameter of the semicircle is the length of the rectangle. Express the area A of the rectangle as a function of the radius r of the semicircle. Express the perimeter p of the rectangle as a function of r.
72. A wire of length x is bent into the shape of a square. Express the perimeter p of the square as a function of x. Express the area A of the square as a function of x.