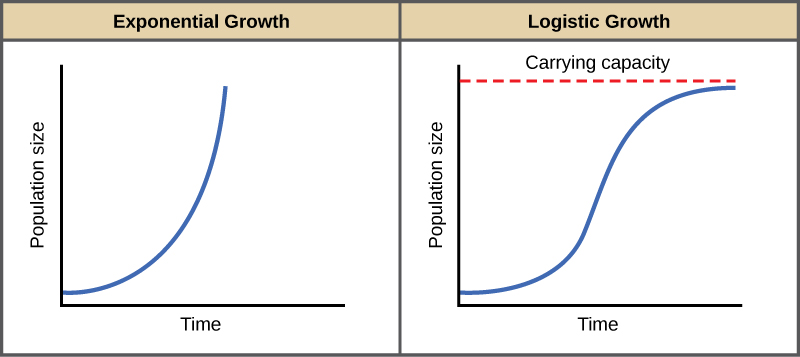
Why practice modeling growth of observable scenarios?
We can apply mathematics to certain real-world situations in order to gain insight into them. When we want to understand the relationship between two quantities in which the outcome of one is dependent upon the input of the other, we look for a mathematical equation that approximates the situation. Plotting a few known data points can lead us to information about what we think relates the quantities, at least in the short run. The resulting graph together with its equation make up a mathematical model. In this module, you’ll learn to use a spreadsheet or a calculator to analyze data, build a model for it, and use your model to gain insight and make predictions about situations involving linear, exponential, and logistic growth.
Candela Citations
- Authored by: Deborah Devlin. Provided by: Lumen Learning. License: CC BY: Attribution
- Exponential Growth Logistic Growth Graph Image. Provided by: OpenStax. License: CC BY: Attribution. License Terms: Download for free at: http://cnx.org/contents/fd53eae1-fa23-47c7-bb1b-972349835c3c@5.175

