Learning Outcomes
- Solve systems of linear inequalities by graphing the solution region
- Graph solutions to a system that contains a compound inequality
We will continue to practice graphing the solution region for systems of linear inequalities. We will also graph the solutions to a system that includes a compound inequality.
Example
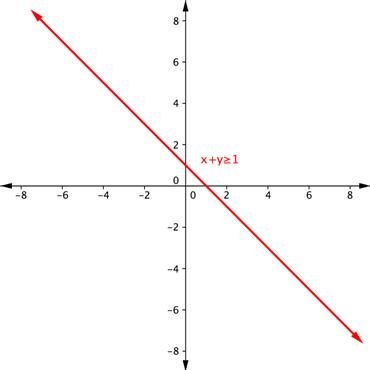
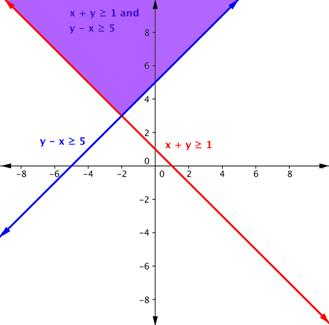
Shade the region of the graph that represents solutions for both inequalities. [latex]x+y\geq1[/latex] and [latex]y–x\geq5[/latex].


The videos that follow show more examples of graphing the solution set of a system of linear inequalities.
The system in our last example includes a compound inequality. We will see that you can treat a compound inequality like two lines when you are graphing them.
Example
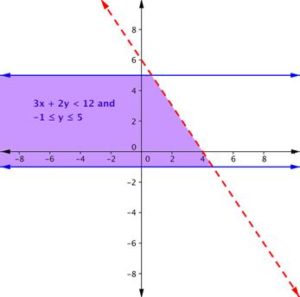
Find the solution to the system [latex]3x + 2y < 12[/latex] and [latex]-1 ≤ y ≤ 5[/latex].


In the video that follows, we show how to solve another system of inequalities that contains a compound inequality.
Candela Citations
- Ex 1: Graph a System of Linear Inequalities. Authored by: James Sousa (Mathispower4u.com) for Lumen Learning. Located at: https://youtu.be/ACTxJv1h2_c. License: CC BY: Attribution
- Ex 2: Graph a System of Linear Inequalities. Authored by: James Sousa (Mathispower4u.com) . Located at: https://youtu.be/cclH2h1NurM. License: CC BY: Attribution
- Determine the Solution to a System of Inequalities (Compound). Authored by: James Sousa (Mathispower4u.com) . Located at: https://youtu.be/D-Cnt6m8l18. License: CC BY: Attribution
- Unit 14: Systems of Equations and Inequalities, from Developmental Math: An Open Program. Provided by: Monterey Institute of Technology. Located at: http://nrocnetwork.org/dm-opentext. License: CC BY: Attribution