Learning Outcome
- Identify whether an ordered pair is in the solution set of a linear inequality
The graph below shows the region of values that makes the inequality [latex]3x+2y\leq6[/latex] true (shaded red), the boundary line [latex]3x+2y=6[/latex], as well as a handful of ordered pairs. The boundary line is solid because points on the boundary line [latex]3x+2y=6[/latex] will make the inequality [latex]3x+2y\leq6[/latex] true.
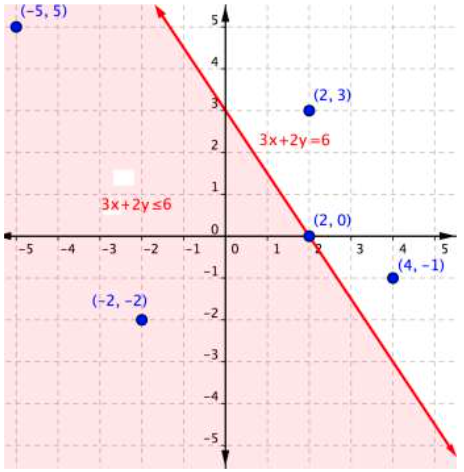
You can substitute the x and y-values of each of the [latex](x,y)[/latex] ordered pairs into the inequality to find solutions. Sometimes making a table of values makes sense for more complicated inequalities.
| Ordered Pair | Makes the inequality [latex]3x+2y\leq6[/latex] a true statement | Makes the inequality [latex]3x+2y\leq6[/latex] a false statement |
|---|---|---|
| [latex](−5, 5)[/latex] | [latex]\begin{array}{r}3\left(−5\right)+2\left(5\right)\leq6\\−15+10\leq6\\−5\leq6\end{array}[/latex] | |
| [latex](−2,−2)[/latex] | [latex]\begin{array}{r}3\left(−2\right)+2\left(–2\right)\leq6\\−6+\left(−4\right)\leq6\\–10\leq6\end{array}[/latex] | |
| [latex](2,3)[/latex] | [latex]\begin{array}{r}3\left(2\right)+2\left(3\right)\leq6\\6+6\leq6\\12\leq6\end{array}[/latex] | |
| [latex](2,0)[/latex] | [latex]\begin{array}{r}3\left(2\right)+2\left(0\right)\leq6\\6+0\leq6\\6\leq6\end{array}[/latex] | |
| [latex](4,−1)[/latex] | [latex]\begin{array}{r}3\left(4\right)+2\left(−1\right)\leq6\\12+\left(−2\right)\leq6\\10\leq6\end{array}[/latex] |
If substituting [latex](x,y)[/latex] into the inequality yields a true statement, then the ordered pair is a solution to the inequality, and the point will be plotted within the shaded region or the point will be part of a solid boundary line. A false statement means that the ordered pair is not a solution, and the point will graph outside the shaded region, or the point will be part of a dotted boundary line.
Example
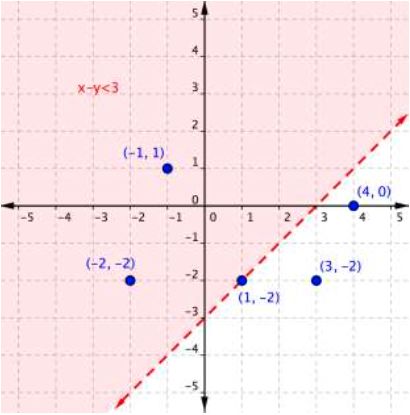
Use the graph to determine which ordered pairs plotted below are solutions of the inequality [latex]x–y<3[/latex].
The following video shows an example of determining whether an ordered pair is a solution to an inequality.
Example
Is [latex](2,−3)[/latex] a solution of the inequality [latex]y<−3x+1[/latex]?
The following video shows another example of determining whether an ordered pair is a solution to an inequality.
Candela Citations
- Use a Graph Determine Ordered Pair Solutions of a Linear Inequalty in Two Variable. Authored by: James Sousa (Mathispower4u.com) . Located at: https://youtu.be/GQVdDRVq5_o. License: CC BY: Attribution
- Ex: Determine if Ordered Pairs Satisfy a Linear Inequality. Authored by: James Sousa (Mathispower4u.com) . Located at: https://youtu.be/-x-zt_yM0RM. License: CC BY: Attribution
- Unit 13: Graphing, from Developmental Math: An Open Program. Provided by: Monterey Institute of Technology. Located at: http://nrocnetwork.org/dm-opentext. License: CC BY: Attribution