Lesson Objectives
- Describe how atmospheric circulation patterns cause storms to form and travel.
- Understand the weather patterns that lead to tornadoes, and identify the different types of cyclones.
- Know what causes a hurricane to form, what causes it to disappear, and what sorts of damage it can do.
- Know the damage that heat waves and droughts can cause.
Vocabulary
- anticyclone
- blizzard
- cyclone
- heat wave
- hurricane
- lake-effect snow
- lightning
- mid-latitude cyclone
- nor’easter
- thunder
- thunderstorm
- tornado
- tropical depression
Introduction
Weather happens every day, but only some days have storms. Storms vary immensely depending on whether they’re warm or cold, coming off the ocean or off a continent, occurring in summer or winter, and many other factors. The effects of storms also vary depending on whether they strike a populated area or a natural landscape. Hurricane Katrina is a good example, since the flooding after the storm severely damaged New Orleans, while a similar storm in an unpopulated area would have done little damage.
Thunderstorms
Thunderstorms are extremely common: Worldwide there are 14 million per year; that’s 40,000 per day! Most drop a lot of rain on a small area quickly, but some are severe and highly damaging.
Thunderstorms form when ground temperatures are high, ordinarily in the late afternoon or early evening in spring and summer. The Figure below show two stages of thunderstorm buildup.

(a) As temperatures increase, warm, moist air rises. These updrafts first form cumulus and then cumulonimbus clouds. (b) Winds at the top of the stratosphere blow the cloud top sideways to make the anvil shape that characterizes a cloud as a thunderhead.
As water vapor condenses to form a cloud, the latent heat makes the air in the cloud warmer than the air outside the cloud. Water droplets and ice fly up through the cloud in updrafts. When these droplets get heavy enough, they fall. This starts a downdraft, and soon there is a convection cell within the cloud. The cloud grows into a cumulonimbus giant. Eventually, the drops become large enough to fall to the ground. At this time, the thunderstorm is mature, and it produces gusty winds, lightning, heavy precipitation, and hail (Figure below).

A mature thunderstorm with updrafts and downdrafts that reach the ground.
The downdrafts cool the air at the base of the cloud, so the air is no longer warm enough to rise. As a result, convection shuts down. Without convection, water vapor does not condense, no latent heat is released, and the thunderhead runs out of energy. A thunderstorm usually ends only 15 to 30 minutes after it begins, but other thunderstorms may start in the same area.
With severe thunderstorms, the downdrafts are so intense that when they hit the ground it sends warm air from the ground upward into the storm. The warm air gives the convection cells more energy. Rain and hail grow huge before gravity pulls them to Earth. Severe thunderstorms can last for hours and can cause a lot of damage because of high winds, flooding, intense hail, and tornadoes.
Thunderstorms can form individually or in squall lines along a cold front. In the United States, squall lines form in spring and early summer in the Midwest where the maritime tropical (mT) air mass from the Gulf of Mexico meets the continental polar (cP) air mass from Canada (Figure below).

Cold air from the Rockies collided with warm, moist air from the Gulf of Mexico to form this squall line.
So much energy collects in cumulonimbus clouds that a huge release of electricity, called lightning, may result (Figure below). The electrical discharge may be between one part of the cloud and another, two clouds, or a cloud and the ground.
A key ingredient of thunderstorms is explored in this National Geographic Video, Natural Disaster, Landslides, and more: Lightning 101 (2:38) at http://video.nationalgeographic.com/video/environment/environment-natural-disasters/landslides-and-more/lightning/.

Lightning behind the town of Diamond Head, Hawaii.
Lightning heats the air so that it expands explosively. The loud clap is thunder. Light waves travel so rapidly that lightning is seen instantly. Sound waves travel much more slowly, so a thunderclap may come many seconds after the lightning is spotted.
Thunderstorms kill approximately 200 people in the United States and injure about 550 Americans per year, mostly from lightning strikes. Have you heard the common misconception that lightning doesn’t strike the same place twice? In fact, lightning strikes the New York City’s Empire State Building about 100 times per year (Figure below).

Lightning strikes some places many times a year, such as the Eiffel Tower in Paris.
An online guide to severe storms from the University of Illinois is found here: http://ww2010.atmos.uiuc.edu/%28Gh%29/guides/mtr/svr/home.rxml.
Tornadoes
Tornadoes, also called twisters, are fierce products of severe thunderstorms (Figure below). As air in a thunderstorm rises, the surrounding air races in to fill the gap, forming a funnel.

A tornado is a funnel shaped, whirling column of air extending downward from a cumulonimbus cloud. The formation of this tornado outside Dimmit, Texas, in 1995 was well studied.
A tornado lasts from a few seconds to several hours. The average wind speed is about 177 kph (110 mph), but some winds are much faster. A tornado travels over the ground at about 45 km per hour (28 miles per hour) and goes about 25 km (16 miles) before losing energy and disappearing (Figure below).

This tornado struck Seymour, Texas, in 1979.
An individual tornado strikes a small area, but it can destroy everything in its path. Most injuries and deaths from tornadoes are caused by flying debris (Figure below). In the United States an average of 90 people are killed by tornadoes each year. The most violent two percent of tornadoes account for 70% of the deaths by tornadoes.
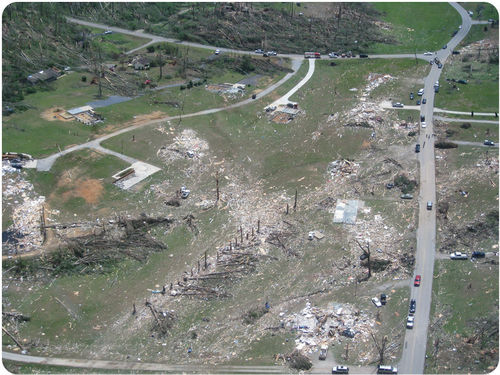
Tornado damage at Ringgold, Georgia in April 2011.
Tornadoes form at the front of severe thunderstorms. Lines of these thunderstorms form in the spring where where maritime tropical (mT) and continental polar (cP) air masses meet. Although there is an average of 770 tornadoes annually, the number of tornadoes each year varies greatly (Figure below).

The frequency of F3, F4, and F5 tornadoes in the United States. The red region that starts in Texas and covers Oklahoma, Nebraska, and South Dakota is called Tornado Alley because it is where most of the violent tornadoes occur.
In late April 2011, the situation was ripe for the deadliest set of tornadoes in 25 years. In addition to the meeting of cP and mT mentioned above, the jet stream was blowing strongly in from the west. The result was more than 150 tornadoes reported throughout the day (Figure below).

The severe thunderstorms pictured in this satellite image spawned the deadliest set of tornadoes in more than 25 years on April 27-28, 2011. The cold air mass is shown by the mostly continuous clouds. Warm moist air blowing north from the Atlantic Ocean and Gulf of Mexico is indicated by small low clouds. Thunderstorms are indicated by bright white patches.
The entire region was alerted to the possibility of tornadoes in those late April days. But meteorologists can only predict tornado danger over a very wide region. No one can tell exactly where and when a tornado will touch down. Once a tornado is sighted on radar, its path is predicted and a warning is issued to people in that area. The exact path is unknown because tornado movement is not very predictable.
Tornado catchers capture footage inside a tornado on this National Geographic video: http://ngm.nationalgeographic.com/ngm/0506/feature6/multimedia.html.
The intensity of tornadoes is measured on the Fujita Scale (see Table below), which assigns a value based on wind speed and damage.
| F Scale | (km/hr) | (mph) | Damage |
|---|---|---|---|
| F0 | 64-116 | 40-72 | Light – tree branches fall and chimneys may collapse |
| F1 | 117-180 | 73-112 | Moderate – mobile homes, autos pushed aside |
| F2 | 181-253 | 113-157 | Considerable – roofs torn off houses, large trees uprooted |
| F3 | 254-33 | 158-206 | Severe – houses torn apart, trees uprooted, cars lifted |
| F4 | 333-419 | 207-260 | Devastating – houses leveled, cars thrown |
| F5 | 420-512 | 261-318 | Incredible – structures fly, cars become missiles |
| F6 | >512 | >318 | Maximum tornado wind speed |
Cyclones
Cyclones can be the most intense storms on Earth. A cyclone is a system of winds rotating counterclockwise in the Northern Hemisphere around a low pressure center. The swirling air rises and cools, creating clouds and precipitation.
There are two types of cyclones: middle latitude (mid-latitude) cyclones and tropical cyclones. Mid-latitude cyclones are the main cause of winter storms in the middle latitudes. Tropical cyclones are also known as hurricanes.
An anticyclone is the opposite of a cyclone. An anticyclone’s winds rotate clockwise in the Northern Hemisphere around a center of high pressure. Air comes in from above and sinks to the ground. High pressure centers generally have fair weather.
Mid-Latitude Cyclones
Mid-latitude cyclones, sometimes called extratropical cyclones, form at the polar front when the temperature difference between two air masses is large. These air masses blow past each other in opposite directions. Coriolis Effect deflects winds to the right in the Northern Hemisphere, causing the winds to strike the polar front at an angle. Warm and cold fronts form next to each other. Most winter storms in the middle latitudes, including most of the United States and Europe, are caused by mid-latitude cyclones (Figure below).

A hypothetical mid-latitude cyclone affecting the United Kingdom. The arrows point the wind direction and its relative temperature; L is the low pressure area. Notice the warm, cold, and occluded fronts.
The warm air at the cold front rises and creates a low pressure cell. Winds rush into the low pressure and create a rising column of air. The air twists, rotating counterclockwise in the Northern Hemisphere and clockwise in the Southern Hemisphere. Since the rising air is moist, rain or snow falls.
Mid-latitude cyclones form in winter in the mid-latitudes and move eastward with the westerly winds. These two- to five-day storms can reach 1,000 to 2,500 km (625 to 1,600 miles) in diameter and produce winds up to 125 km (75 miles) per hour. Like tropical cyclones, they can cause extensive beach erosion and flooding.
Mid-latitude cyclones are especially fierce in the mid-Atlantic and New England states where they are called nor’easters, because they come from the northeast. About 30 nor’easters strike the region each year. (Figure below).

The 1993 “Storm of the Century” was a nor’easter that covered the entire eastern seaboard of the United States.
An online guide to mid-latitude cyclones from the University of Illinois is found here: http://ww2010.atmos.uiuc.edu/%28Gh%29/guides/mtr/cyc/home.rxml.
Hurricanes
Tropical cyclones have many names. They are called hurricanes in the North Atlantic and eastern Pacific oceans, typhoons in the western Pacific Ocean, tropical cyclones in the Indian Ocean, and willi-willi’s in the waters near Australia (Figure below). By any name, they are the most damaging storms on Earth.
Hurricanes arise in the tropical latitudes (between 10° and 25°N) in summer and autumn when sea surface temperature are 28°C (82°F) or higher. The warm seas create a large humid air mass. The warm air rises and forms a low pressure cell, known as a tropical depression. Thunderstorms materialize around the tropical depression.
If the temperature reaches or exceeds 28°C (82°F) the air begins to rotate around the low pressure (counterclockwise in the Northern Hemisphere and clockwise in the Southern Hemisphere). As the air rises, water vapor condenses, releasing energy from latent heat. If wind shear is low, the storm builds into a hurricane within two to three days.

A cross-sectional view of a hurricane.
Hurricanes are huge with high winds. The exception is the relatively calm eye of the storm where air is rising upward. Rainfall can be as high as 2.5 cm (1″) per hour, resulting in about 20 billion metric tons of water released daily in a hurricane. The release of latent heat generates enormous amounts of energy, nearly the total annual electrical power consumption of the United States from one storm. Hurricanes can also generate tornadoes.
Hurricanes are assigned to categories based on their wind speed. The categories are listed on the Saffir-Simpson hurricane scale (Table below).
| Category | Kph | Mph | Estimated Damage |
|---|---|---|---|
| 1 (weak) | 119-153 | 74-95 | Above normal; no real damage to structures |
| 2 (moderate) | 154-177 | 96-110 | Some roofing, door, and window damage, considerable damage to vegetation, mobile homes, and piers |
| 3 (strong) | 178-209 | 111-130 | Some buildings damaged; mobile homes destroyed |
| 4 (very strong) | 210-251 | 131-156 | Complete roof failure on small residences; major erosion of beach areas; major damage to lower floors of structures near shore |
| 5 (devastating) | >251 | >156 | Complete roof failure on many residences and industrial buildings; some complete building failures |
Hurricanes move with the prevailing winds. In the Northern Hemisphere, they originate in the trade winds and move to the west. When they reach the latitude of the westerlies, they switch direction and travel toward the north or northeast. Hurricanes may cover 800 km (500 miles) in one day.
Damage from hurricanes comes from the high winds, rainfall, and storm surge. Storm surge occurs as the storm’s low pressure center comes onto land, causing the sea level to rise unusually high. A storm surge is often made worse by the hurricane’s high winds blowing seawater across the ocean onto the shoreline. Flooding can be devastating, especially along low-lying coastlines such as the Atlantic and Gulf Coasts. Hurricane Camille in 1969 had a 7.3 m (24 foot) storm surge that traveled 125 miles (200 km) inland.
Hurricanes typically last for 5 to 10 days. Over cooler water or land, the hurricane’s latent heat source shut downs and the storm weakens. When a hurricane disintegrates, it is replaced with intense rains and tornadoes.
Hurricanes are explored in a set of National Geographic videos found at National Geographic Video, Natural disaster, Hurricanes:
- “Hurricanes 101” is an introduction to the topic.
- “How Katrina Formed” looks at the history of Hurricane Katrina as it formed and passed through the Gulf coast.
- Follow that up with “Doomed New Orleans,” which explores how the devastation to the city is a man-made disaster.
- “The Hurricane Ike of 1900” looks at what happened in the days when there was little warning before a hurricane hit a coastal city.
There are about 100 hurricanes around the world each year, plus many smaller tropical storms and tropical depressions. As people develop coastal regions, property damage from storms continues to rise. However, scientists are becoming better at predicting the paths of these storms and fatalities are decreasing. There is, however, one major exception to the previous statement: Hurricane Katrina.
Lots of information about hurricanes is found in this online guide from the University of Illinois: http://ww2010.atmos.uiuc.edu/%28Gh%29/guides/mtr/hurr/home.rxml.
The 2005 Atlantic hurricane season was the longest, costliest, and deadliest hurricane season so far. Total damage from all the storms together was estimated at more than $128 billion, with more than 2,280 deaths. Hurricane Katrina was both the most destructive hurricane and the most costly (Figure below and Figure below).

Hurricane Katrina nears its peak strength as it travels across the Gulf of Mexico.
News about Hurricane Katrina from the New Orleans Times-Picayune: http://www.nola.com/katrina/graphics/flashflood.swf.
An animation of a radar image of Hurricane Katrina making landfall is seen here: http://upload.wikimedia.org/wikipedia/commons/9/97/Hurricane_Katrina_LA_landfall_radar.gif.
NASA’s short video, In Katrina’s Wake: http://www.youtube.com/watch?v=HZjqvqaLltI.

Flooding in New Orleans after Hurricane Katrina caused the levees to break and water to pour through the city.
Blizzards and Lake-Effect Snow
A blizzard is distinguished by certain conditions (Figure below):
- Temperatures below –7°C (20°F); –12°C (10°F) for a severe blizzard.
- Winds greater than 56 kmh (35 mph); 72 kmh (45 mph) for a severe blizzard.
- Snow so heavy that visibility is 2/5 km (1/4 mile) or less for at least three hours; near zero visibility for a severe blizzard.

A near white out in a blizzard in Massachusetts.
Blizzards happen across the middle latitudes and toward the poles, usually as part of a mid-latitude cyclone. Blizzards are most common in winter, when the jet stream has traveled south and a cold, northern air mass comes into contact with a warmer, semitropical air mass (Figure below). The very strong winds develop because of the pressure gradient between the low pressure storm and the higher pressure west of the storm. Snow produced by the storm gets caught in the winds and blows nearly horizontally. Blizzards can also produce sleet or freezing rain.

Blizzard snows blanket the East Coast of the United States in February 2010.
In winter, a continental polar air mass travels down from Canada. As the frigid air travels across one of the Great Lakes, it warms and absorbs moisture. When the air mass reaches the leeward side of the lake, it is very unstable and it drops tremendous amounts of snow. This lake-effect snow falls on the snowiest, metropolitan areas in the United States: Buffalo and Rochester, New York (Figure below).

Frigid air travels across the Great Lakes and dumps lake-effect snow on the leeward side.
Heat Wave
Even more insidious are the deadliest weather phenomena, a heat wave. A heat wave is different for different locations; it is a long period of hot weather, at least 86°F (30°C) for at least three days in cooler locations but much more in hotter locations. Heat waves have increased in frequency and duration in recent years.
What do you think caused the heat wave in the Figure below? A high pressure zone kept the jet stream further north than normal for August.

A heat wave over the United States as indicated by heat radiated from the ground. The bright yellow areas are the hottest and the blue and white are coolest.
Lesson Summary
- Thunderstorms arise over warm ground when updrafts form cumulonimbus clouds that rain and hail.
- Tornadoes form most commonly from thunderstorms. They are relatively short-lived and small, but they do an enormous amount of damage where they strike.
- Cyclones of all sorts are large and damaging; they include nor’easters and hurricanes.
Review Questions
1. Describe in detail how a thunderstorm forms and where the energy to fuel it comes from. Start with a warm day and no clouds.
2. How does a thunderstorm break apart and disappear?
3. Why does a thunderstorm get more severe rather than losing energy and disappearing?
4. What are lightning and thunder?
5. Discuss the pros and cons of living in an area that is prone to tornadoes versus one that is prone to hurricanes.
6. Where are tornadoes most common in the United States?
7. What is a cyclone? What are the two types of cyclone and how do they differ?
8. Describe in detail how a hurricane forms.
9. What level is the most damaging hurricane on the Saffir-Simpson scale? What sorts of damage do you expect from such a strong hurricane?
10. What causes damage from hurricanes?
11. What could have been done in New Orleans to lessen the damage and deaths from Hurricane Katrina?
12. Do you think New Orleans should be rebuilt in its current location?
13. Where do blizzards develop?
Further Reading / Supplemental Links
Hunt for the Supertwister from PBS: http://access.ncsa.illinois.edu/Stories/supertwister/index.htm
Points to Consider
- Why is predicting where tornadoes will go and how strong they will be so difficult?
- How would the damage done by Hurricane Katrina have been different if the storm had taken place 100 years ago?
- What knowledge do meteorologists need to better understand storms?
Candela Citations
- Earth Science for High School. Provided by: CK-12. Located at: http://www.ck12.org/book/CK-12-Earth-Science-For-High-School/. License: CC BY-NC: Attribution-NonCommercial