Learning Goals
After completing this section, you should feel comfortable performing these skills.
- Calculate the mean of a small data set by hand.
- Calculate the median of a small data set by hand.
- Use a data analysis tool to calculate the mean of a large data set.
- Use a data analysis tool to calculate the median of a large data set.
- Estimate the mean of a data set by examining a histogram of its distribution.
- Estimate the median of a data set by examining a histogram of its distribution.
- Use a data analysis tool to calculate and compare the mean and median for multiple groups at once.
- Use a histogram to estimate and compare centers for multiple groups.
Click on a skill above to jump to its location in this section.
In the next activity, you’ll need to use technology to calculate the mean and median of numerical data in order to compare groups. You will also need to interpret histograms to estimate the mean and median of a data set. Get some practice with these skills in this section.
Calculating Mean and Median
Recall
You’ve probably seen the terms mean and median before. Before we discuss in detail how to calculate them, take a minute to see if you can recall doing it before. Do you remember how these terms are defined?
Core skill:
In most of the activities that follow, we’ll be using technology to calculate the mean and median of large data sets. A close look at the notation of the mean and a refresher of how to calculate the median, though, will be helpful before you move forward. Much of the statistics presented in this course involves mathematical notation. The symbols used can appear similar, which causes some confusion until they become familiar to you. It will be helpful to spend some time getting to know the mathematical notation for the mean and practice calculating means and medians of small data sets by hand.
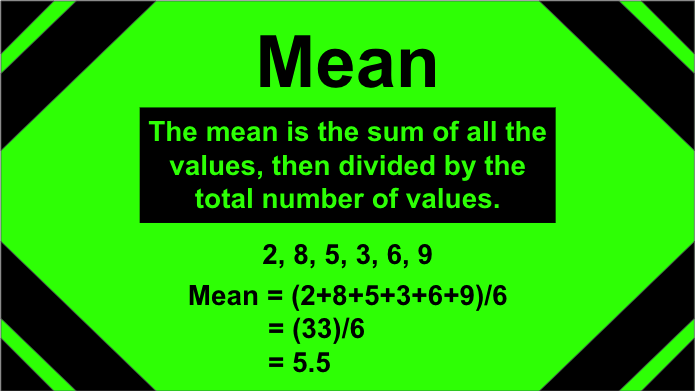
Mean
Calculating the Mean by Hand
Need a video demo of the notation and translation of it to the example given below (students know how to get the average — it’s the notation for which they have no existing cognitive anchor).
You may recall from a previous mathematics or statistics class that the mean of a data set can be computed by summing the data values and dividing by the number of values,
[latex]\text{mean } = \dfrac{\text{sum of data values}}{\text{total number of data values}}[/latex]
or more formally,
[latex]\bar{x}=\dfrac{\sum{x}}{n}[/latex]
where [latex]\bar{x}[/latex] is the mean, [latex]\sum[/latex] is the symbol for “sum of,” [latex]x[/latex] represents the data values, and [latex]n[/latex] is the total number of data values.
For example, consider this small set of data values:
[latex]3.3\qquad 1.2\qquad 5.8\qquad 10.0\qquad 3.6\qquad 8.7\qquad 4.5[/latex]
As seen below, the sum of these values is [latex]37.1[/latex], and there are [latex]7[/latex] values. Dividing these numbers, we determine that the mean is [latex]5.3[/latex].
[latex]\bar{x}=\dfrac{3.3+1.2+5.8+10+3.6+8.7+4.5}{7}=\dfrac{37.1}{7}=5.3[/latex]
Examples
Calculate the mean of each small data set below.
a) [latex]7, 4, 8, 2, 3, 6[/latex]
b) [latex]1.2, 3.9, 5.3, 4.2[/latex]
c) [latex]79, 86, 92, 93, 88[/latex]
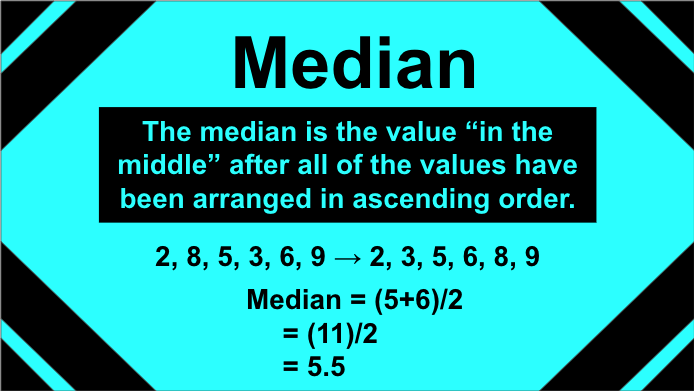
Median
Another measure of center you may recall is the median. This value is computed by ordering the data values and identifying the value in “the middle.”
If we consider the sample data from above, ordering these values from least to greatest, we get:
[latex]1.2\qquad 3.3\qquad 3.6\qquad 4.5\qquad 5.8\qquad 8.7\qquad 10.0[/latex]
The value [latex]4.5[/latex] is the “middle number” in the ordered set; we see there are three values less than [latex]4.5[/latex] ([latex]1.2, 3.3, 3.6[/latex]) and three values greater than [latex]4.5[/latex] ([latex]5.8, 8.7, 10.0[/latex]). The value [latex]4.5[/latex] is the median.
[latex]\cancel{1.2}\qquad \cancel{3.3}\qquad \cancel{3.6}\qquad 4.5\qquad \cancel{5.8}\qquad \cancel{8.7}\qquad \cancel{10.0}[/latex]
If there are an odd number of observations, the “middle number” is the number that is left alone after all of the others have been crossed out. If there are an even number of observations, the “middle number” is the mean of the middle two observations. Check out the following videos to practice finding the median. The first video is using an odd number of observations, and the second is using an even number of observations.
finding the median using an odd numbered data set
Need a video demo showing the “counting in from the ends” to find the middle-most number in an odd numbered set.–>video starts at 2:00, it should stop around 2:48.
finding the median using an even numbered data set
Need a video demo showing the “counting in from the ends” to find the middle-most number in an even numbered set.–>same video but starting at 10:32 and it should stop around 11:22.
Examples
Calculate the median of each small data set below. These are the same sets used earlier to calculate the mean.
a) [latex]7, 4, 8, 2, 3, 6[/latex]
b) [latex]1.2, 3.9, 5.3, 4.2[/latex]
c) [latex]79, 86, 92, 93, 88[/latex]
Now you try it by taking the mean and median of the small set of data below.
question 1
Large data sets
At this point, students will be presented with two datasets. They will be able to choose which one they would like to use to answer example questions before using the Descriptive Statistics in the data analysis tool.
When computing these values with a large data set, it is not efficient to do so by hand. Instead, we will rely on technology to calculate these values. Let’s try that now.
Go to the Describing and Exploring Quantitative Variables tool at https://dcmathpathways.shinyapps.io/EDA_quantitative/.
Step 1) Select the Single Group tab.
Step 2) Locate the dropdown under Enter Data and select From Textbook.
Step 3) Locate the drop-down menu under Data Set and select Sleep Study: Average Sleep.
This data set contains the average number of hours of sleep per night for each of the [latex]253[/latex] students in the sleep study.
Note the Descriptive Statistics located above the graphical display. You’ll find the mean and median located in the list. Eventually, we will use all the values shown but for now we just want to record the mean and median. To use the tool to calculate descriptive statistics for any data set, load, copy and paste, or type the data values into the “Observations” box of the tool, and it will automatically list the values in the “Descriptive Statistics.”
question 2
Mean and Median as the Center of Data
There are other ways that we can think about the mean and median as measures of center of numerical data. More specifically, the mean represents the balance point of the data, and the median represents the [latex]50[/latex]th percentile, or the value that splits the data in half (i.e., half of the data are below the median and the other half of the data are above the median).
mean and median
[Perspective Video – a 3-instructor video illustrating the mean as a balance point and the median as splitting the data in half]
question 3
question 4
Using Technology to Calculate and Compare Centers Across Groups
[Worked example video – a 3-instructor video providing an example like the one below for questions 5 – 7]
Another benefit of using technology to calculate the mean and median is that we can quickly calculate these values for multiple groups. We can do so by using the Several Groups tab on the Describing and Exploring Quantitative Variables tool (the same tool you used to complete questions 2 – 4 above).
Go to the Describing and Exploring Quantitative Variables tool at https://dcmathpathways.shinyapps.io/EDA_quantitative/.
Step 1) Select the Several Groups tab.
Step 2) Under Enter Data, select From Textbook.
Step 3) Locate the drop-down menu under Data Set, and select Sleep Study: Average Sleep Score.
Step 4) Change Choose Type of Plot to Histogram if desired.
Step 5) Calculate the mean and median for each of the groups: “Owl,” “Lark,” and “Neither,” and list these values in the table in question 5 below (Note: the mean and median will be automatically calculated by the technology and can be found under Descriptive Statistics).
Recall that “Owl” describes the group of students who tends to stay up late, and “Lark” describes the group who tends to wake up early. Students who did not identify as an owl nor a lark were classified in the “Neither” group.
Recall also that we consider the mean to be the arithmetic mean (commonly called the “average”) of a set of numbers, while the median refers to the value that sits in the middle of the distribution with half of the values above it and half of the values below.
question 5
question 6
question 7
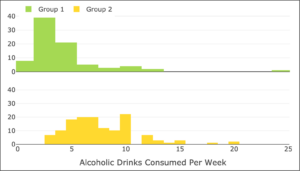
Histograms
The following image uses histograms to compare the distribution of the variable “Alcoholic Drinks Per Week” for two groups of college students in this study. Based on these histograms, determine whether you believe the following statements are true or false.
question 8
question 9
question 10
question 11
Summary
In this section, you’ve gained practice calculating means and medians by hand and with technology. Let’s summarize where these skills showed up in the material.
- In question 1, you calculated the mean and median of a data set by hand.
- In question 2, you calculated the mean and median of a data set using technology.
- In question 5, you used technology to calculate the mean and median for multiple groups.
- In questions 6 and 7, you compared the mean and median for multiple groups.
- In questions 3, 4, and 8 – 11, you estimated the mean and median by looking at the data presented in a histogram.
Being able to use technology to calculate the mean and median of numerical data in order to compare groups, as well as interpreting histograms to estimate the mean and median of a data set will be necessary for completing the next activity. If you feel comfortable with these skills, please move on to the activity!
