Two Population Means with Unknown Standard Deviations
1. two proportions
3. matched or paired samples
6. independent group means, population standard deviations and/or variances unknown
8. two proportions
10. independent group means, population standard deviations and/or variances unknown
11. independent group means, population standard deviations and/or variances unknown
13. two proportions
15. The random variable is the difference between the mean amounts of sugar in the two soft drinks.
17. means
19. two-tailed
21. the difference between the mean life spans of whites and nonwhites
23. This is a comparison of two population means with unknown population standard deviations.
27.
- Reject the null hypothesis
- p-value < 0.05
- There is not enough evidence at the 5% level of significance to support the claim that life expectancy in the 1900s is different between whites and nonwhites.
30.
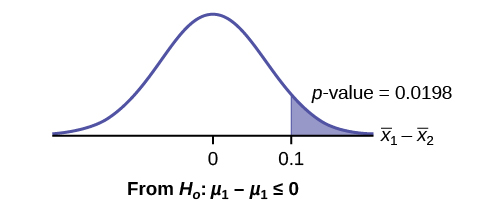
- H0: μ1 ≥ μ2
- Ha: μ1 < μ2
- [latex]\overline{X}_{1}–\overline{X}_{2}[/latex]is the difference between the mean enrollments of the two-year colleges and the four-year colleges.
- Student’s-t
- test statistic: -0.2480
- p-value: 0.4019
- Check student’s solution.
-
- Alpha: 0.05
- Decision: Do not reject
- Reason for Decision: p-value > alpha
- Conclusion: At the 5% significance level, there is sufficient evidence to conclude that the mean enrollment at four-year colleges is higher than at two-year colleges.
32.
Subscripts: 1: mechanical engineering; 2: electrical engineering
- H0: µ1 ≥ µ2
- Ha: µ1 < µ2
- [latex]\overline{X}_{1}–\overline{X}_{2}[/latex] is the difference between the mean entry level salaries of mechanical engineers and electrical engineers.
- t108
- test statistic: t = –0.82
- p-value: 0.2061
- Check student’s solution.
-
- Alpha: 0.05
- Decision: Do not reject the null hypothesis.
- Reason for Decision: p-value > alpha
- Conclusion: At the 5% significance level, there is insufficient evidence to conclude that the mean entry-level salaries of mechanical engineers is lower than that of electrical engineers.
34.
- H0: µ1 = µ2
- Ha: µ1 ≠ µ2
- [latex]\overline{X}_{1}–\overline{X}_{2}[/latex] is the difference between the mean times for completing a lap in races and in practices.
- t20.32
- test statistic: –4.70
- p-value: 0.0001
- Check student’s solution.
-
- Alpha: 0.05
- Decision: Reject the null hypothesis.
- Reason for Decision: p-value < alpha
- Conclusion: At the 5% significance level, there is sufficient evidence to conclude that the mean time for completing a lap in races is different from that in practices.
36.
- H0: µ1 = µ2
- Ha: µ1 ≠ µ2
- [latex]\overline{X}_{1}–\overline{X}_{2}[/latex] is the difference between the mean times for completing a lap in races and in practices.
- t40.94
- test statistic: –5.08
- p-value: zero
- Check student’s solution.
-
- Alpha: 0.05
- Decision: Reject the null hypothesis.
- Reason for Decision: p-value < alpha
- Conclusion: At the 5% significance level, there is sufficient evidence to conclude that the mean time for completing a lap in races is different from that in practices.
39. There is insufficient evidence to conclude that the W teams score fewer goals, on average, than the E teams score.
41.Test: two independent sample means, population standard deviations unknown.Random variable:[latex]\overline{X}_{1}–\overline{X}_{2}[/latex]Distribution: H0: μ1 = μ2Ha: μ1 < μ2 The mean age of entering prostitution in Canada is lower than the mean age in the United States.

Graph: left-tailed
p-value : 0.0151
Decision: Do not reject H0.
Conclusion: At the 1% level of significance, from the sample data, there is not sufficient evidence to conclude that the mean age of entering prostitution in Canada is lower than the mean age in the United States.
43. μday ≠ μnight
Two Population Means with Known Standard Deviations
50.
Subscripts: 1 = Food, 2 = No Food
H0: μ1 ≤ μ2
Ha: μ1 > μ2
the graph of the p-value.
54.
Subscripts: 1 = Gamma, 2 = Zeta
H0: μ1 = μ2
Ha: μ1 ≠ μ2
56. 0.0062
58. There is sufficient evidence to reject the null hypothesis. The data support that the melting point for Alloy Zeta is different from the melting point of Alloy Gamma.
60.
Subscripts: 1 = boys, 2 = girls
- H0: µ1 ≤ µ2
- Ha: µ1 > µ2
- The random variable is the difference in the mean auto insurance costs for boys and girls.
- normal
- test statistic: z = 2.50
- p-value: 0.0062
- Check student’s solution.
-
- Alpha: 0.05
- Decision: Reject the null hypothesis.
- Reason for Decision: p-value < alpha
- Conclusion: At the 5% significance level, there is sufficient evidence to conclude that the mean cost of auto insurance for teenage boys is greater than that for girls.
62.
Subscripts: 1 = non-hybrid sedans, 2 = hybrid sedans
- H0: µ1 ≥ µ2
- Ha: µ1 < µ2
- The random variable is the difference in the mean miles per gallon of non-hybrid sedans and hybrid sedans.
- normal
- test statistic: 6.36
- p-value: 0
- Check student’s solution.
-
- Alpha: 0.05
- Decision: Reject the null hypothesis.
- Reason for decision: p-value < alpha
- Conclusion: At the 5% significance level, there is sufficient evidence to conclude that the mean miles per gallon of non-hybrid sedans is less than that of hybrid sedans.
64.
- H0: µd = 0
- Ha: µd < 0
- The random variable Xd is the average difference between husband’s and wife’s satisfaction level.
- t9
- test statistic: t = –1.86
- p-value: 0.0479
- Check student’s solution
-
- Alpha: 0.05
- Decision: Reject the null hypothesis, but run another test.
- Reason for Decision: p-value < alpha
- Conclusion: This is a weak test because alpha and the p-value are close. However, there is insufficient evidence to conclude that the mean difference is negative.
Comparing Two Independent Population Proportions
66. P′OS1 – P′OS2 = difference in the proportions of phones that had system failures within the first eight hours of operation with OS1 and OS2.
68. 0.1018
70. proportions
72. right-tailed
74. The random variable is the difference in proportions (percents) of the populations that are of two or more races in Nevada and North Dakota.
76. Our sample sizes are much greater than five each, so we use the normal for two proportions distribution for this hypothesis test.
80.
p-value: 0.8458
Check student’s solution.
- Alpha: 0.05
- Decision: Reject the null hypothesis.
- Reason for decision: p-value > alpha
- Conclusion: At the 5% significance level, there is insufficient evidence to conclude that the proportions of white and black female suicide victims, aged 15 to 24, are different.
85.
Subscripts: 1 = Cabrillo College, 2 = Lake Tahoe College
- H0: p1 = p2
- Ha: p1 ≠ p2
- The random variable is the difference between the proportions of Hispanic students at Cabrillo College and Lake Tahoe College.
- normal for two proportions
- test statistic: 4.29
- p-value: 0.00002
- Check student’s solution.
-
- Alpha: 0.05
- Decision: Reject the null hypothesis.
- Reason for decision: p-value < alpha
- Conclusion: There is sufficient evidence to conclude that the proportions of Hispanic students at Cabrillo College and Lake Tahoe College are different.
87. p2011 ≤ p2010
89.
Test: two independent sample proportions.
Random variable: p′1 – p′2
Distribution:
H0: p1 = p2
Ha: p1 ≠ p2
The proportion of eReader users is different for the 16- to 29-year-old users from that of the 30 and older users.
Graph: two-tailed
p-value : 0.0033
Decision: Reject the null hypothesis.
Conclusion: At the 5% level of significance, from the sample data, there is sufficient evidence to conclude that the proportion of eReader users 16 to 29 years old is different from the proportion of eReader users 30 and older.
91.
Test: two independent sample proportions
Random variable: p′1 − p′2
Distribution:
H0: p1 = p2
Ha: p1 > p2
A higher proportion of tablet owners are aged 16 to 29 years old than are 30 years old and older.
Graph: right-tailed
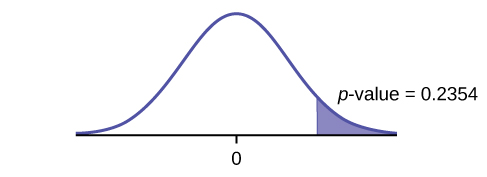
p-value: 0.2354
Decision: Do not reject the H0.
Conclusion: At the 1% level of significance, from the sample data, there is not sufficient evidence to conclude that a higher proportion of tablet owners are aged 16 to 29 years old than are 30 years old and older.
93.
Subscripts: 1: men; 2: women
- H0: p1 ≤ p2
- Ha: p1 > p2
- P′1−P′2 is the difference between the proportions of men and women who enjoy shopping for electronic equipment.
- normal for two proportions
- test statistic: 0.22
- p-value: 0.4133
- Check student’s solution.
-
- Alpha: 0.05
- Decision: Do not reject the null hypothesis.
- Reason for Decision: p-value > alpha
- Conclusion: At the 5% significance level, there is insufficient evidence to conclude that the proportion of men who enjoy shopping for electronic equipment is more than the proportion of women.
95.
- H0: p1 = p2
- Ha: p1 ≠ p2
- P′1−P′2 is the difference between the proportions of men and women that have at least one pierced ear.
- normal for two proportions
- test statistic: –4.82
- p-value: zero
- Check student’s solution.
-
- Alpha: 0.05
- Decision: Reject the null hypothesis.
- Reason for Decision: p-value < alpha
- Conclusion: At the 5% significance level, there is sufficient evidence to conclude that the proportions of males and females with at least one pierced ear is different.
97.
- H0: µd = 0
- Ha: µd > 0
- The random variable Xd is the mean difference in work times on days when eating breakfast and on days when not eating breakfast.
- t9
- test statistic: 4.8963
- p-value: 0.0004
- Check student’s solution.
-
- Alpha: 0.05
- Decision: Reject the null hypothesis.
- Reason for Decision: p-value < alpha
- Conclusion: At the 5% level of significance, there is sufficient evidence to conclude that the mean difference in work times on days when eating breakfast and on days when not eating breakfast has increased.
98. the mean difference of the system failures
100. 0.0067
102. With a p-value 0.0067, we can reject the null hypothesis. There is enough evidence to support that the software patch is effective in reducing the number of system failures.
104. 0.0021
106.
the graph of the p-value.
108.
H0: μd ≥ 0
Ha: μd < 0
110. 0.0699
112. We decline to reject the null hypothesis. There is not sufficient evidence to support that the medication is effective.
113.
p-value = 0.1494
At the 5% significance level, there is insufficient evidence to conclude that the medication lowered cholesterol levels after 12 weeks.
115. There is sufficient evidence to conclude that the method reduces the proportion of HIV positive patients who develop AIDS after four years.
117. 0.0155; There is sufficient evidence to conclude that the blood pressure decreased after the training.
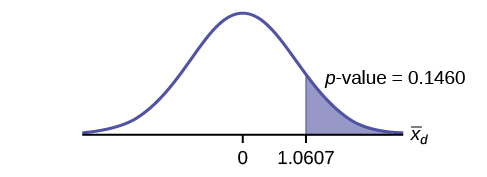
119.
Test: two matched pairs or paired samples (t-test)
Random variable: [latex]\overline{X}_{d}[/latex]
Distribution: t12
H0: μd = 0 Ha: μd > 0
The mean of the differences of new female breast cancer cases in the south between 2013 and 2012 is greater than zero. The estimate for new female breast cancer cases in the south is higher in 2013 than in 2012.
Graph: right-tailed
p-value: 0.0004
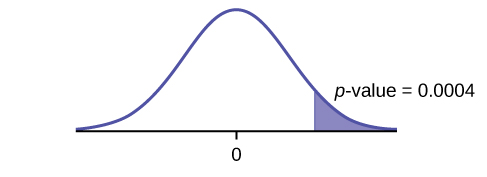
Decision: Reject H0
Conclusion: At the 5% level of significance, from the sample data, there is sufficient evidence to conclude that there was a higher estimate of new female breast cancer cases in 2013 than in 2012.
121.
Test: matched or paired samples (t-test)
Difference data: {–0.9, –3.7, –3.2, –0.5, 0.6, –1.9, –0.5, 0.2, 0.6, 0.4, 1.7, –2.4, 1.8}
Random Variable:[latex]\overline{X}_{d}[/latex]
Distribution: H0: μd = 0 Ha: μd < 0
The mean of the differences of the rate of underemployment in the northeastern states between 2012 and 2011 is less than zero. The underemployment rate went down from 2011 to 2012.
Graph: left-tailed.
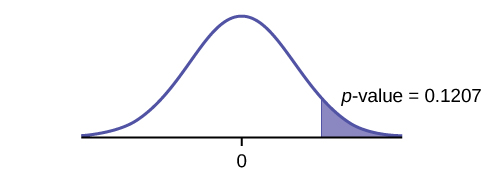
p-value: 0.1207
Decision: Do not reject H0.
Conclusion: At the 5% level of significance, from the sample data, there is not sufficient evidence to conclude that there was a decrease in the underemployment rates of the northeastern states from 2011 to 2012.
123. two proportions
125. single mean
127. single proportion
129. two proportions
131. single proportion
133. a test of two independent means.
Candela Citations
- Introductory Statistics . Authored by: Barbara Illowski, Susan Dean. Provided by: Open Stax. Located at: http://cnx.org/contents/30189442-6998-4686-ac05-ed152b91b9de@17.44. License: CC BY: Attribution. License Terms: Download for free at http://cnx.org/contents/30189442-6998-4686-ac05-ed152b91b9de@17.44