Learning Objectives
- Venn Diagrams for unions, intersections, and complements
Venn Diagrams
To visualize the interaction of sets, John Venn in 1880 thought to use overlapping circles, building on a similar idea used by Leonhard Euler in the 18th century. These illustrations now called Venn Diagrams.
VENN DIAGRAM
A Venn diagram represents each set by a circle, usually drawn inside of a containing box representing the universal set. Overlapping areas indicate elements common to both sets.
Basic Venn diagrams can illustrate the interaction of two or three sets.
Example
Create Venn diagrams to illustrate A ⋃ B, A ⋂ B, and A’ ⋂ B
A ⋃ B contains all elements in either set.


Example
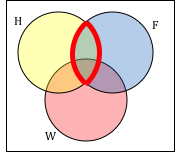
Use a Venn diagram to illustrate (H ⋂ F)’ ⋂ W

Example
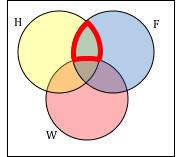
Create an expression to represent the outlined part of the Venn diagram shown.
Try It
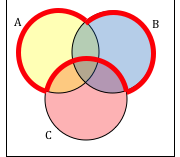
Create an expression to represent the outlined portion of the Venn diagram shown.
This is the end of the section. Close this tab and proceed to the corresponding assignment.
