Learning Outcomes
- Solve inequalities with one variable using graphs of functions.
Solving Inequalities with One Variable using One Function
Recall DISTINCT PARTS OF A GRAPH of a Function AND THEIR [latex]y[/latex] VALUES
(a) When a graph is below the [latex]x[/latex]-axis, [latex]y[/latex] values are negative. So, [latex]f(x)<0[/latex].
(b) When a graph is on the [latex]x[/latex]-axis, [latex]y[/latex] values are zero. So, [latex]f(x)=0[/latex].
(c) When a graph is above the [latex]x[/latex]-axis, [latex]y[/latex] values are positive. So, [latex]f(x)>0[/latex].
As we have seen, we can solve an equation [latex]f(x)=0[/latex] by finding the [latex]x[/latex]-intercepts of its function [latex]y=f(x)[/latex]. That means we can solve an equation [latex]f(x)=0[/latex] by finding the [latex]x[/latex] values when the graph of [latex]y=f(x)[/latex] is on the [latex]x[/latex]-axis. We can apply the idea to solve inequalities with one variable.
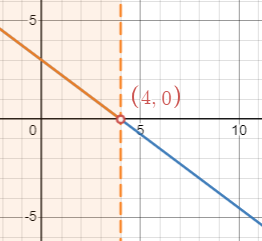
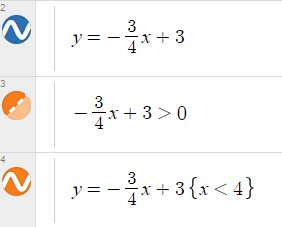
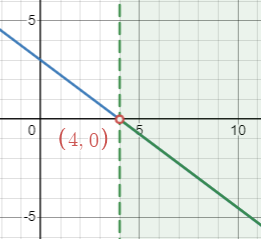
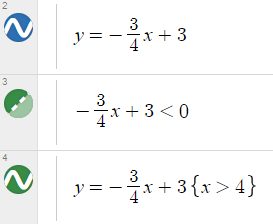
In the previous section, we talked about [latex]-\frac{3}{4}x+3=0[/latex]. Now let’s consider the inequalities [latex]-\frac{3}{4}x+3>0[/latex] and [latex]-\frac{3}{4}x+3<0[/latex]. According to the relationship above, to solve [latex]-\frac{3}{4}x+3>0[/latex], we can find the [latex]x[/latex] values when the graph of [latex]f(x)=-\frac{3}{4}x+3[/latex] is above the [latex]x[/latex]-axis and below the [latex]x[/latex]-axis, respectively.
Example: Solving [latex]f(x) \geq 0[/latex] Graphically
Solve the inequality graphically. Use a graphing tool.
[latex]x^3-x-4x^2+4 \geq 0[/latex]
Show Answer
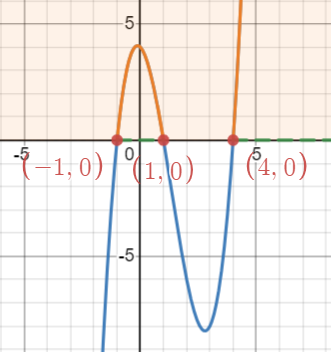
Let [latex]f(x)=x^3-x-4x^2+4[/latex]. Then find the parts that are above or on the [latex]x[/latex]-axis because [latex]f(x)[/latex] is “greater than ([latex]>[/latex]),” which is above the [latex]x[/latex]-axis, or “equal to ([latex]=[/latex]),” which is on the [latex]x[/latex]-axis. From the graph, we can see that the graph of [latex]f(x)=x^3-x-4x^2+4[/latex] is above the [latex]x[/latex]-axis when [latex]-14[/latex] and on the [latex]x[/latex]-axis when [latex]x=-1, 1, 4[/latex]. So, the solution of the inequality [latex]x^3-x-4x^2+4 \leq 0[/latex] is [latex][-1, 1] \cup [4, \infty)[/latex] or [latex]\{x|-1 \leq x \leq 1[/latex] or [latex]x \geq 4\}[/latex].
Try It
Solve the inequality graphically. Use a graphing tool.
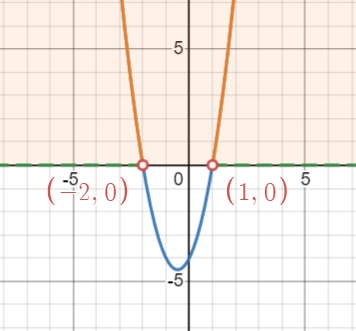
[latex](x-1)^4-3(x-1)^2-4 \leq 0[/latex]
Show Answer
Let [latex]f(x)=(x-1)^4-3(x-1)^2-4[/latex]. Then find the parts that are below or on the [latex]x[/latex]-axis. From the graph, we can see that the graph of [latex]f(x)=(x-1)^4-3(x-1)^2-4[/latex] is below the [latex]x[/latex]-axis when [latex]-1
Try It
Solve the inequality graphically. Use a graphing tool.
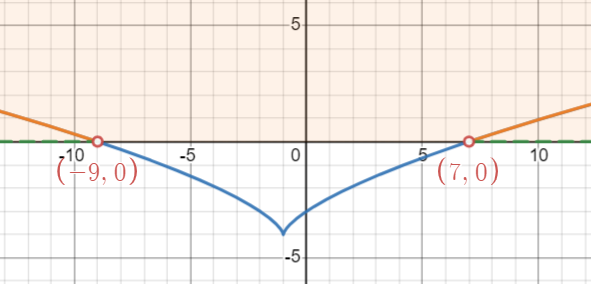
[latex]\sqrt[3]{(x+1)^2}-4>0[/latex]
Show Answer
Let [latex]f(x)=\sqrt[3]{(x+1)^2}-4[/latex]. Then find the parts that are above the [latex]x[/latex]-axis. From the graph, we can see that the graph of [latex]f(x)=\sqrt[3]{(x+1)^2}-4[/latex] is above the [latex]x[/latex]-axis when [latex]x<-9[/latex] or [latex]x>7[/latex]. So, the solution of the inequality [latex]\sqrt[3]{(x+1)^2}>4[/latex] is [latex](-\infty, -9)\cup(7, \infty)[/latex] or [latex]\{x|x<-9[/latex] or [latex]x>7\}[/latex].
Solving Equations with One Variable using Multiple Functions
Example: Solving [latex]f(x)>g(x)[/latex] Graphically
Solve the inequality graphically. Use a graphing tool.
[latex]2x^2-3>-2x+1[/latex]
Show Answer
Method 1
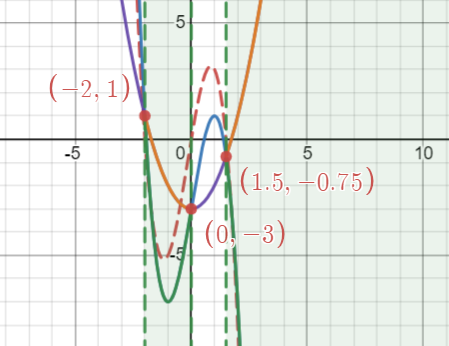
Move all terms to the left: [latex]2x^2-3+2x-1>0[/latex]*
* If you are using a graphing tool, you don’t need to simplify the inequality. Just let [latex]f(x)=2x^2-3-(-2x+1)[/latex] or [latex]f(x)=2x^2-3+2x-1[/latex].
So, [latex]2x^2+2x-4>0[/latex].
Let [latex]f(x)=2x^2+2x-4[/latex]. Then find the parts that are above the [latex]x[/latex]-axis.
Since the graph of [latex]f(x)=2x^2+2x-4[/latex] is above the [latex]x[/latex]-axis when [latex]x<-2[/latex] or [latex]x>1[/latex], the solution of the inequality [latex]2x^2-3>-2x+1[/latex] is [latex](-\infty, -2)\cup(1, \infty)[/latex] or [latex]\{x|x<-2[/latex] or [latex]x>1\}[/latex].
Method 2
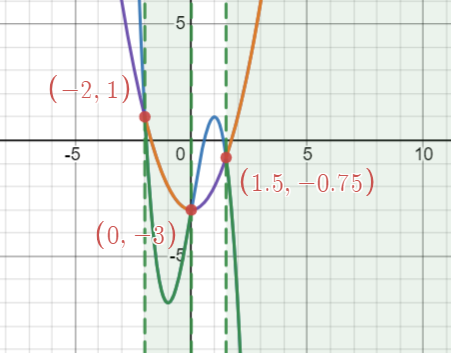
Let [latex]f(x)=2x^2-3[/latex] and [latex]g(x)=-2x+1[/latex]. Then find the parts where [latex]f(x)>g(x)[/latex], which means where the graph of [latex]f(x)[/latex] is above the graph of [latex]g(x)[/latex].
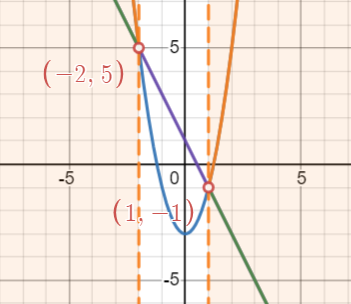
Since the graph of [latex]f(x)=2x^2-3[/latex] is above the graph of [latex]g(x)=-2x+1[/latex] when [latex]x<-2[/latex] or [latex]x>1[/latex], the solution of the inequality [latex]2x^2-3>-2x+1[/latex] is [latex](-\infty, -2)\cup(1, \infty)[/latex] or [latex]\{x|x<-2[/latex] or [latex]x>1\}[/latex].
Try It
Solve the inequality graphically. Use a graphing tool.
[latex]-2x^3+6x-3 \leq x^2-3[/latex]
Show Answer
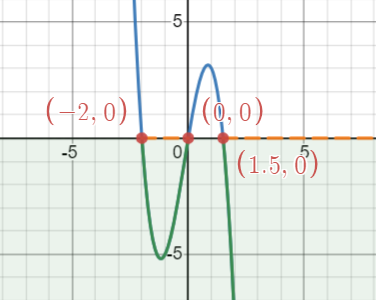
Move all terms to the lefthand side: [latex]-2x^3+6x-3-x^2+3 \leq 0[/latex]. Then let [latex]f(x)=-2x^3-x^2+6x[/latex]. Since the graph of[latex]f(x)=-2x^3-x^2+6x[/latex] is below the [latex]x[/latex]-axis when [latex]-2\frac{3}{2}[/latex] and on the [latex]x[/latex]-axis when [latex]x=-2, 0, \frac{3}{2}[/latex], the solution of the inequality [latex]-2x^3+6x-3 \leq x^2-3[/latex] is [latex][-2, 0] \cup [\frac{3}{2}, \infty)[/latex] or [latex]\{x|-2 \leq x \leq 0[/latex] or [latex]x \geq \frac{3}{2}\}[/latex].
OR
Let [latex]g(x)=-2x^3+6x-3[/latex] and [latex]h(x)=x^2-3[/latex]. Since the graph of [latex]g(x)=-2x^3+6x-3[/latex] is below the graph of [latex]h(x)=x^2-3[/latex] when [latex]-2\frac{3}{2}[/latex] and intersects the graph of [latex]h(x)=x^2-3[/latex] when [latex]x=-2, 0, \frac{3}{2}[/latex], the solution of the inequality [latex]-2x^3+6x-3 \leq x^2-3[/latex] is [latex][-2, 0] \cup [\frac{3}{2}, \infty)[/latex] or [latex]\{x|-2 \leq x \leq 0[/latex] or [latex]x \geq \frac{3}{2}\}[/latex].
Candela Citations
CC licensed content, Original
- Solving Inequalities Using Graphs of Functions. Authored by: Michelle Eunhee Chung. Provided by: Georgia State University. License: CC BY: Attribution