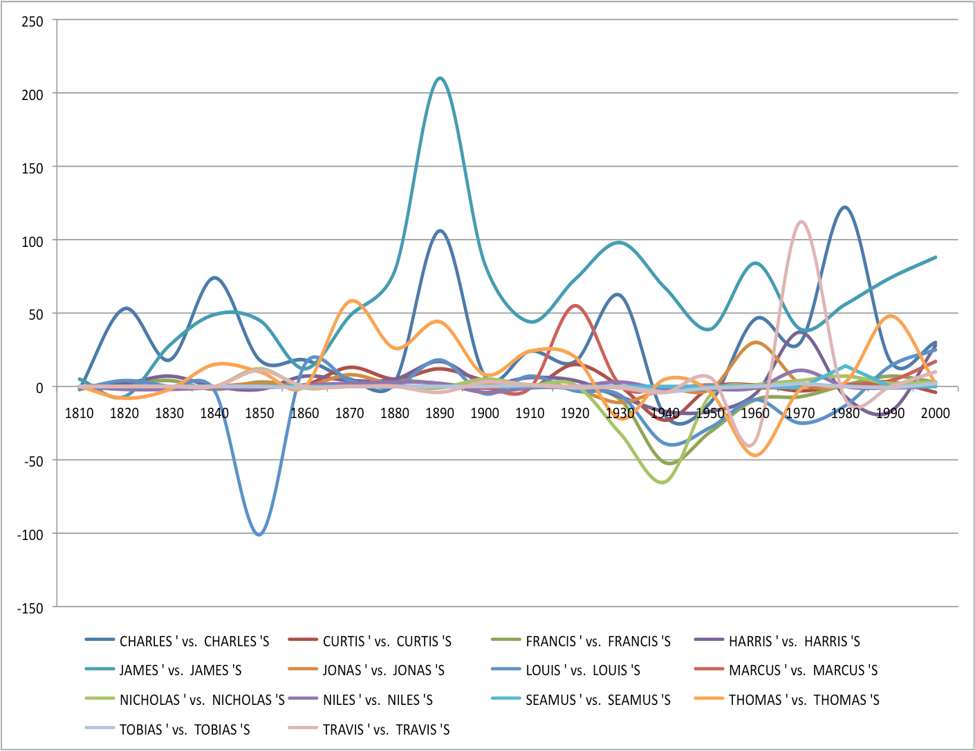
Figure 1. Graph Comparing Incidences of Type A and Type B
When did it become correct to add an “s” to a singular possessive already ending in “-s”? Among many answers, one of the authors compared a number of names ending in -s looking for possessive forms with and without a final s and created a graph comparing incidences of Type A (with a final s) and Type B (without a final s) forms. The author explained that the y-axis shows the difference in incidence between types A and B. If it is above 0, that means that type A was more common in that period; if below 0, that means type B was more common.[1]
As we can see, graphs are used in many different fields and provide us with numerous information. However, did you know that we can use graphs of functions to solve equations and inequalities as well? In this section, we will study how to relate the solutions of equations and inequalities to its functions.
Candela Citations
- 2.5 Introduction to Solving Equations and Inequalities using Graphs of Functions. Authored by: Michelle Eunhee Chung. Provided by: Georgia State University. License: CC BY: Attribution
- StackExchange (https://english.stackexchange.com/questions/2964/when-did-it-become-correct-to-add-an-s-to-a-singular-possessive-already-ending) ↵
