Learning Outcomes
- Solve equations with one variable using graphs of functions.
Solving Equations with One Variable using One Function
As we have seen, we can solve an equation [latex]f(x)=0[/latex] by finding the [latex]x[/latex]-intercepts of its function [latex]y=f(x)[/latex], and the graph of [latex]y=f(x)[/latex] makes the process much easier. For example, we can easily locate the [latex]x[/latex]-intercept of [latex]f(x)=-\frac{3}{4}x+3[/latex] from its graph, and we can conclude that the solution of [latex]-\frac{3}{4}x+3=0[/latex] is [latex]x=4[/latex].
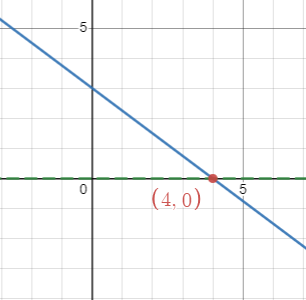
Figure 3. Graph of [latex]f(x)=-\frac{3}{4}x+3[/latex]
Moreover, this method helps us to solve more complex equations as well. For example, to solve [latex]x+\frac{3}{x}-4=0[/latex], we should consider the graph of [latex]f(x)=x+\frac{3}{x}-4[/latex] and find the [latex]x[/latex]-intercepts. As we can read on the graph, the [latex]x[/latex]-intercepts of this function are [latex](1, 0)[/latex] and [latex](3, 0)[/latex]. So, the solutions of the equation are [latex]x=1, 3[/latex].
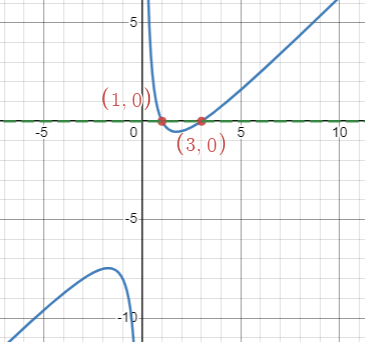
Figure 4. Graph of [latex]f(x)=x+\frac{3}{x}-4[/latex]
Example: Solving [latex]f(x)=0[/latex] Graphically
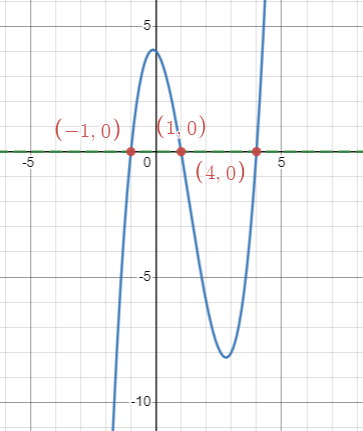
Solve the equation graphically. Use a graphing tool.
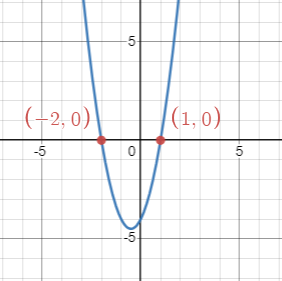
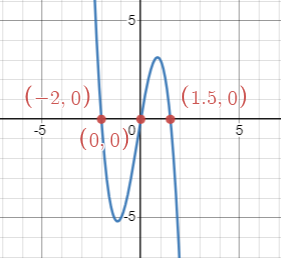
[latex]x^3-x-4x^2+4=0[/latex]
Try It
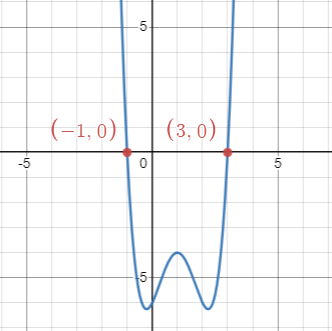
Solve the equation graphically. Use a graphing tool.
[latex](x-1)^4-3(x-1)^2-4=0[/latex]
Example: Solving [latex]f(x)=0[/latex] Graphically
Solve the equation graphically. Use a graphing tool.
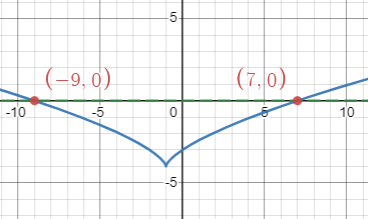
[latex]\sqrt[3]{(x+1)^2}-4=0[/latex]
Try It
Solve the equation graphically. Use a graphing tool.
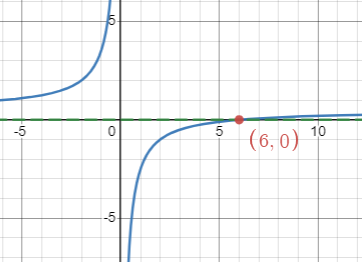
[latex]\frac{x-3}{x}-\frac{1}{2}=0[/latex]
Solving Equations with One Variable using Multiple Functions
Now we know how to solve equations graphically. But what if the given equation is not in “[latex]f(x)=0[/latex]” form? How can we apply the method we used in the previous examples? There are two different ways to solve this equation:
- Move all terms to the left and make it in “[latex]f(x)=0[/latex]” form. Then, graph and find the [latex]x[/latex]-intercepts.
- Let “[latex]f(x)=[/latex](lefthand side)” and “[latex]g(x)=[/latex](righthand side).” Then, graph and find the intersecting points of [latex]f(x)[/latex] and [latex]g(x)[/latex]. The [latex]x[/latex]-coordinates are the solutions of the equation.
Example: Solving [latex]f(x)=g(x)[/latex] Graphically
Solve the equation graphically. Use a graphing tool.
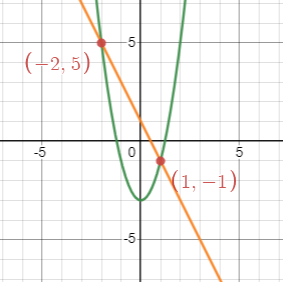
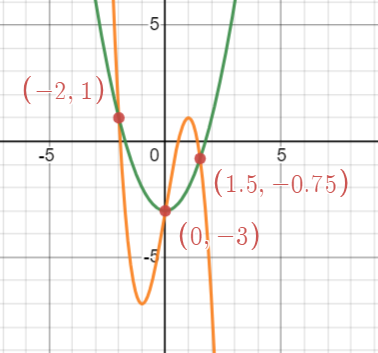
[latex]2x^2-3=-2x+1[/latex]
Try It
Solve the equation graphically. Use a graphing tool.
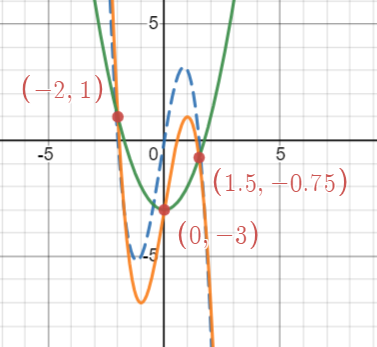
[latex]-2x^3+6x-3=x^2-3[/latex]
Candela Citations
- Solving Equations Using Graphs of Functions. Authored by: Michelle Eunhee Chung. Provided by: Georgia State University . License: CC BY: Attribution