Learning Objectives
|
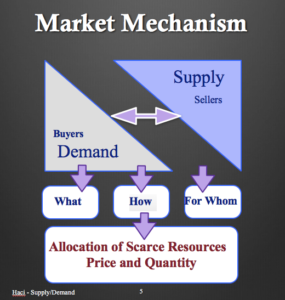
 Markets are institutions where buyers and sellers come together to exchange goods and services; there are many types of markets, physical like a supermarket, virtual like Ebay, local and international and more. Markets have two sides: the buyers/consumers who represent the Demand side of the market, and sellers/producers who represent the Supply side of the market. The two sides share information through markets to help them make critical decisions and meet their needs: the buyers gather information about products availability, features and prices while sellers figure out what consumers desire and prefer. Overall, markets play a crucial role in our economy as they provide a tool to allocate our scarce resources, and answer the following critical questions:
|
|
|
|
|
|
Car Auction-S. Haci-2015 |
|
The interaction of buyers and sellers through markets helps us organize the economy efficiently and achieve some social welfare. Next, the model of Supply and Demand describes consumers and sellers behavior based on price which is a crucial element in the decision process for both groups.
Candela Citations
- Car auction photo. Authored by: S.Haci. Located at: https://s3-us-west-2.amazonaws.com/courses-images/wp-content/uploads/sites/1681/2017/08/02184616/DSC02577.jpg. License: CC BY: Attribution
- Market Mechanism slide. Authored by: S.Haci. Provided by: HCCS. Located at: https://s3-us-west-2.amazonaws.com/courses-images/wp-content/uploads/sites/1681/2017/08/02161220/mkt-mechanism.png. License: CC BY: Attribution
- Supply and Demand slide. Authored by: S.Haci. Provided by: HCCS. Located at: https://s3-us-west-2.amazonaws.com/courses-images/wp-content/uploads/sites/1681/2017/08/02161223/Role-of-price.png. License: CC BY: Attribution
- Supermarket picture. Authored by: Franco Folini. Provided by: Flickr. Located at: https://www.flickr.com/photos/livenature/17385497352/in/photolist-suidEm-WBEXPQ-6Qfn59-7Brtsd-5fH35c-5sAief-Uwx1Sq-opQw7K-bjfTMp-9FgjPS-oN8hvU-sndeMH-kKiAf-johHQ-5iQUf4-4LRd4A-5iQUAP-aS1tHR-xMn4-bzhFx4-9FghWG-aS1qsc-tqzBR-5iVcPh-gDdCq2-9FdoCK-5fMpth-46Rpnp-b4KynX-9FdoTr-7D2v1s-9Fdoox-5dEHoB-4ZjyPj-4NNbPH-56Zvt-7Bo44K-51zmF1-pBRCcq-QzFka7-5iVcso-D33rMe-5iQTNe-4Eajg9-7bf64i-WWESK-qZK7mC-7hE76P-b8hLA-89g59t. License: CC BY-SA: Attribution-ShareAlike
- Consumer Expenditures graph. Authored by: Bureau of Labor Statistics. Provided by: Bureau of Labor Statistics - https://www.bls.gov/opub/ted/2016/share-of-total-spending-on-healthcare-increased-from-5-percent-in-1984-to-8-percent-in-2014.htm. Located at: https://s3-us-west-2.amazonaws.com/courses-images/wp-content/uploads/sites/1681/2017/08/02190512/chart-1.png. License: Public Domain: No Known Copyright


