The Production Possibility Frontier
The Production Possibility Frontier is a simple economic model that illustrates the limited nature of our resources and the choices that societies have to make when deciding what to produce. To simplify we will assume two goods or services and examine the quantities that can be produced by an economy efficiently using a determined set of resources (labor, land, capital and entrepreneurship) and technology.
| Production per week | Combination 1 | Combo 2 | Combo 3 | Combo 4 | Combo 5 | Combo 6 |
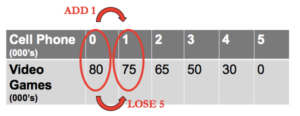
| Cell Phones (000’s) | 0 | 1 | 2 | 3 | 4 | 5 |
| Video Games (000’s) | 80 | 75 | 65 | 50 | 30 | 0 |
If this economy choose combination 1, it uses all its available resources to produce video games only, but if it chooses combination 3, it will produce 2,000 cell phones and 65,000 video games.
Scarcity and Opportunity Cost
This economy is limited in the numbers of cell phones and videos games it can produce and has to give up some video games in order to produce more cell phones.
 |
The opportunity cost of the first 1000 cellphones is 5,000 video games that can no longer be produced |
|
The graphical representation of the Production PossibilityFrontier as a downward sloping bowed out curve reflect scarcity and opportunity cost. Producing a combination outside of the Production Possibility Frontier is impossible given limited resources and technology. |
Efficiency
All combinations of cell phones and video games represented on the Production Possibility Frontier are achieved through an efficient use of available resources and technology. Now, imagine that this economy is underusing its resources and experiencing high unemployment, as a result it would only be able to produce a smaller combinations of cell phones and video games laying inside the Production Possibility Frontier and falling below its potential.
|
Similarly, all combinations outside the Production Possibility Frontier are impossible to attain given the available resource and technology. |
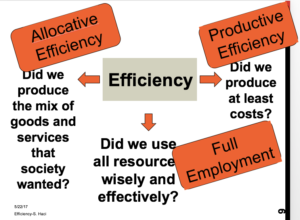
Any combination of cellphones and video games on the Production Possibility Frontier achieves productive efficiency meaning that each good has been produced using the least costly combination of resources and it would be impossible to produce more cell phones without reducing the number of video games produced.
But which combination of cell phones and video games is the best? That combination would depend on societies values and preferences and would achieve allocative efficiency because it would represent the mix of products most wanted by society; any other combination would result in lower benefits for society.
|
What an economy needs to be fully efficient. |
More about opportunity cost
The Production Possibility Frontier reflects another aspect of economic production. If you take a closer look at the opportunity cost of producing cell phones, you can observe that each additional cell phone cost more and more video games.
|
The first cell phone cost 5 video games, the second cost 10 video games and the third one cost 15 video games. As more cell phones are produced. the cost of each additional phone keeps increasing. This pattern of production is described in the Law of Increasing Opportunity Cost: Ceteris Paribus, as the production of one good or service increases, the cost of each additional unit increases. Opportunity cost increases because the resources available even though they can be used to produce either goods, they are not equally productive in doing so. |
|
|
Take the example of labor, if you already have produced 3,000 cellphones and want to produce an additional 1,000 unit, the people with the appropriate skills will now be in short supply, and you will have to rely on labor whose skills were well suited to video games production and therefore, you will lose an ever larger number of video games to each additional cell phone. Increasing opportunity cost translates into an increasing slope for the production possibility frontier and gives it its ‘bowed out’ shape |
Candela Citations
- table - PPF. Authored by: S.Haci. Provided by: HCCS. Located at: https://s3-us-west-2.amazonaws.com/courses-images/wp-content/uploads/sites/1681/2017/05/22042930/PPf-opp-cost.png. License: CC BY: Attribution
- graph - PPF. Authored by: S. Haci. Provided by: HCCS. Located at: https://s3-us-west-2.amazonaws.com/courses-images/wp-content/uploads/sites/1681/2017/05/22043511/ppf-graph.png. License: CC BY: Attribution
- graph - efficiency. Authored by: S.Haci. Provided by: HCCS. Located at: https://s3-us-west-2.amazonaws.com/courses-images/wp-content/uploads/sites/1681/2017/05/22053257/efficiency.png. License: CC BY: Attribution
- graph - increasing opportunity cost. Authored by: S.Haci. Provided by: HCCS. Located at: https://s3-us-west-2.amazonaws.com/courses-images/wp-content/uploads/sites/1681/2017/05/26044141/inc-opp-cost.png. License: CC BY: Attribution
- PPf graph. Authored by: S.Haci. Provided by: HCCS. Located at: https://s3-us-west-2.amazonaws.com/courses-images/wp-content/uploads/sites/1681/2017/05/22051625/ppf-3.png. License: CC BY: Attribution
- PPF graph 2 - opp cost. Authored by: S. Haci. Provided by: HCCS. Located at: https://s3-us-west-2.amazonaws.com/courses-images/wp-content/uploads/sites/1681/2017/05/26042033/opp-cost-3.png. License: CC BY: Attribution
- Picture - fence. Authored by: Rachel Samanyi. Provided by: Flickr. Located at: https://www.flickr.com/photos/sarairachel/7526343460/in/photolist-ct5tGq-bagdbr-3QrzLy-bsy9tY-fcV39e-97hyH6-mKaP8K-zv4Mc-2srbru-5dDPKP-fqf7zu-5imLnV-9bB2Vx-4ZC3Zz-qsHKAG-qjkLGQ-8Vaoa3-uEMD9-T5g2cH-cf78xW-Tgx9Mq-5FXcu2-TMbgDd-T8HaGV-nPUNkd-ai5LiS-pWwEEn-pGQxeU-UPN1XM-oVThAU-4LQreG-5gMmoi-dKnyph-3TXc3-97aUfA-2Nve14-5qsnb8-ezc4if-65AEaY-dWHbBL-e8xGcH-6UJfnF-4bnJVv-7txxEn-4QNNH-5A1auT-4eDToG-4798mz-9uKUaS-qKCKn8. License: CC BY: Attribution


