Learning Outcomes
- Write a piecewise function that represents an application
- Graph a piecewise function using domain
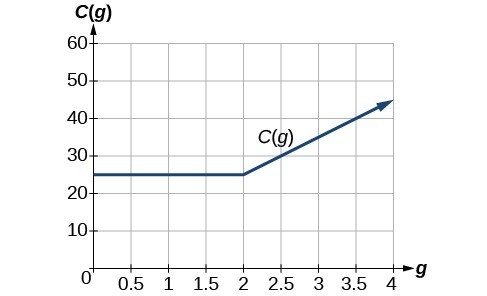
In this section, we will plot piecewise functions. The function plotted below represents the cost to transfer data for a given cell phone company. We can see where the function changes from a constant to a line with a positive slope at [latex]g=2[/latex]. When we plot piecewise functions, it is important to make sure each formula is applied on its proper domain. [latex]C\left(g\right)=\begin{cases}{25} \text{ if }{ 0 }<{ g }<{ 2 }\\10g+5\text{ if }{ g}\ge{ 2 }\end{cases}[/latex]
In this case, the output is [latex]25[/latex] for any input between [latex]0[/latex] and [latex]2[/latex]. For values equal to or greater than [latex]2[/latex], the output is defined as [latex]10g+5[/latex].
How To: Given a piecewise function, sketch a graph
- Indicate on the x-axis the boundaries defined by the intervals on each piece of the domain.
- For each piece of the domain, graph on that interval using the corresponding equation pertaining to that piece. Do not graph two functions over one interval because it would violate the criteria of a function.
Example
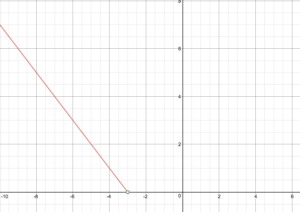
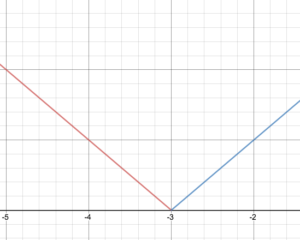
Sketch a graph of the function and state its domain and range.
Given the piecewise definition [latex]f(x)=\begin{cases}−x − 3\text{ if }x < −3\\ x + 3\text{ if } x \ge −3\end{cases}[/latex]
In the next example, we will graph a piecewise-defined function that models the cost of shipping for an online comic book retailer.
Example
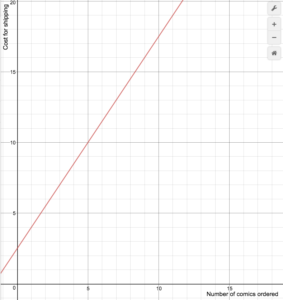
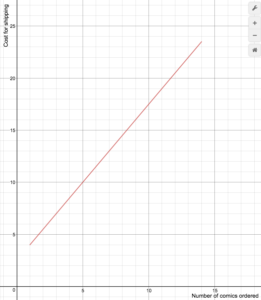
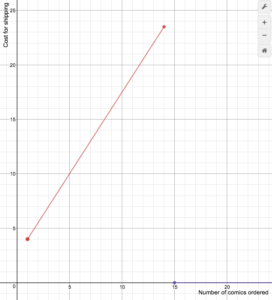
An on-line comic book retailer charges shipping costs according to the following formula, where n is the number of comic books:
[latex]S(n)=\begin{cases}1.5n+2.5\text{ if }1\le{n}\le14\\0\text{ if }n\ge15\end{cases}[/latex]
Draw a graph of the cost function.
In the following video, we show how to graph a piecewise-defined function which is linear over both domains.
Summary
To graph piecewise functions, first identify where the domain is partitioned by boundary values. Graph functions on the domain using tools such as plotting points or transformations. Be sure to use open or closed circles on the endpoints of each domain based on whether the endpoint is included.
Candela Citations
- Revision and Adaptation. Provided by: Lumen Learning. License: CC BY: Attribution
- College Algebra, Unit 1.4 Function Notation. Authored by: Carl Stitz and Jeff Zeager. Located at: http://www.stitz-zeager.com/szca07042013.pdf. License: CC BY: Attribution
- Ex 2: Graph a Piecewise Defined Function. Authored by: James Sousa (Mathispower4u.com) . Located at: https://youtu.be/B1jfpiI-QQ8. License: CC BY: Attribution
- College Algebra. Authored by: Jay Abramson, et al.. Provided by: OpenStax. Located at: http://cnx.org/contents/fd53eae1-fa23-47c7-bb1b-972349835c3c@5.175. License: CC BY: Attribution. License Terms: Download for free at: http://cnx.org/contents/fd53eae1-fa23-47c7-bb1b-972349835c3c@5.175