Learning Outcomes
- Solve systems of equations by substitution
- Identify inconsistent systems of equations containing two variables
Solving a linear system in two variables by graphing works well when the solution consists of integer values, but if our solution contains decimals or fractions, it is not the most precise method. We will consider two more methods of solving a system of linear equations that are more precise than graphing. One such method is solving a system of equations by the substitution method where we solve one of the equations for one variable and then substitute the result into the other equation to solve for the second variable. Recall that we can solve for only one variable at a time which is the reason the substitution method is both valuable and practical.
How To: Given a system of two equations in two variables, solve using the substitution method
- Solve one of the two equations for one of the variables in terms of the other.
- Substitute the expression for this variable into the second equation, and then solve for the remaining variable.
- Substitute that solution into either of the original equations to find the value of the other variable. If possible, write the solution as an ordered pair.
- Check the solution in both equations.
Example
Solve the following system of equations by substitution.
In the following video, you will be given an example of solving a system of two equations using the substitution method.
If you had chosen the other equation to start with in the previous example, you would still be able to find the same solution. It is really a matter of preference, because sometimes solving for a variable will result in having to work with fractions. As you become more experienced with algebra, you will be able to anticipate what choices will lead to more desirable outcomes.
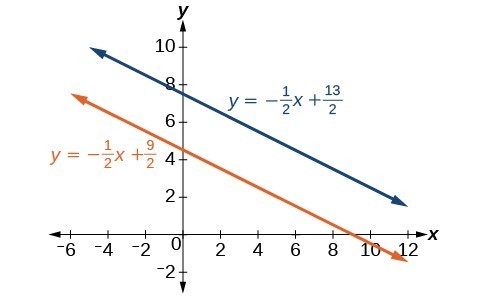
Recall that an inconsistent system consists of parallel lines that have the same slope but different y-intercepts. They will never intersect. When searching for a solution to an inconsistent system, we will come up with a false statement such as [latex]12=0[/latex].
Example
Solve the following system of equations.
[latex]\begin{array}{l}x=9 - 2y\hfill \\ x+2y=13\hfill \end{array}[/latex]
In the next video, we show another example of using substitution to solve a system that has no solution.
In our next video, we show that a system can have an infinite number of solutions.
Consider a skateboard manufacturer’s revenue function; this is the function used to calculate the amount of money that comes into the business. It can be represented by the equation [latex]R=xp[/latex], where [latex]x=[/latex] quantity and [latex]p=[/latex] price. The revenue function is shown in orange in the graph below.
The cost function is the function used to calculate the costs of doing business. It includes fixed costs, such as rent and salaries, and variable costs, such as utilities. The cost function is shown in blue in the graph below. The x-axis represents the quantity of skateboards produced and sold in hundreds of units. The y-axis represents either cost or revenue in hundreds of dollars.
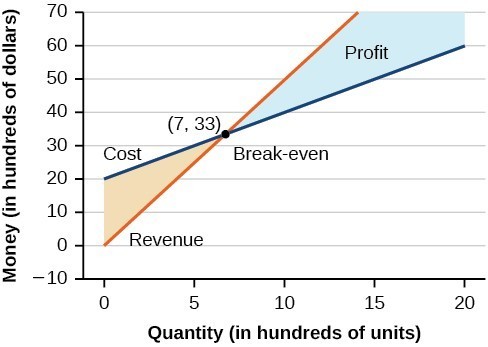
The point at which the two lines intersect is called the break-even point. We can see from the graph that if 700 units are produced, the cost is [latex]$3,300[/latex] and the revenue is also [latex]$3,300[/latex]. In other words, the company breaks even if they produce and sell 700 units. They neither make money nor lose money.
The shaded region to the right of the break-even point represents quantities for which the company makes a profit. The shaded region to the left represents quantities for which the company suffers a loss.
Example
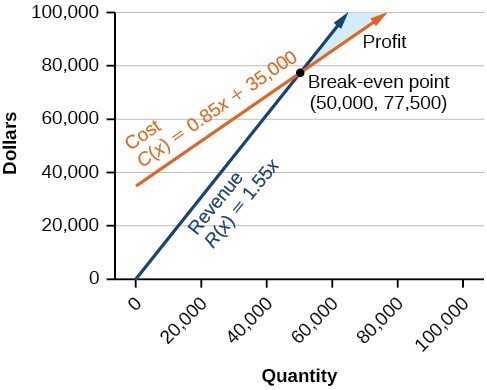
Given the cost function [latex]C\left(x\right)=0.85x+35,000[/latex] and the revenue function [latex]R\left(x\right)=1.55x[/latex], find the break-even point.
In the next example, we will show how to write a system of linear equations given attendance and ticket cost data. We will then find the number of tickets purchased based on our system.
Example
The cost of a ticket to the circus is [latex]$25.00[/latex] for children and [latex]$50.00[/latex] for adults. On a certain day, attendance at the circus is [latex]2,000[/latex] and the total gate revenue is [latex]$70,000[/latex]. How many children and how many adults bought tickets?
In our last video example, we show how to set up a system of linear equations that represents the total cost for admission to a museum.
In the next section, we will introduce more methods for solving systems of equations that cannot be easily solved by substitution.
Candela Citations
- Ex 2: Solve a System of Equations Using Substitution. Authored by: James Sousa (Mathispower4u.com) . Located at: https://youtu.be/MIXL35YRzRw. License: CC BY: Attribution
- Unit 14: Systems of Equations and Inequalities, from Developmental Math: An Open Program. Provided by: Monterey Institute of Technology. Located at: http://nrocnetwork.org/dm-opentext. License: CC BY: Attribution
- Ex: Solve a System of Equations Using Substitution - No Solution. Authored by: James Sousa (Mathispower4u.com) . Located at: https://youtu.be/kTtKfh5gFUc. License: CC BY: Attribution
- Ex: Solve a System of Equations Using Substitution - Infinite Solutions. Authored by: James Sousa (Mathispower4u.com) . Located at: https://youtu.be/Pcqb109yK5Q. License: CC BY: Attribution
- Ex: Solve an Application Problem Using a System of Linear Equations (09x-43). Authored by: James Sousa (Mathispower4u.com) . Located at: https://youtu.be/euh9ksWrq0A. License: CC BY: Attribution
- Precalculus. Authored by: OpenStax College. Provided by: OpenStax. Located at: http://cnx.org/contents/fd53eae1-fa23-47c7-bb1b-972349835c3c@5.175:1/Preface. License: CC BY: Attribution