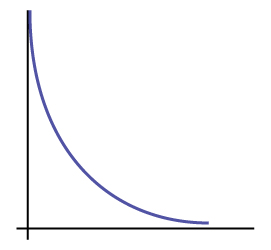
Facts About the Chi-Square Distribution
1. If the number of degrees of freedom for a chi-square distribution is 25, what is the population mean and standard deviation?
3. When does the chi-square curve approximate a normal distribution?
4. Where is μ located on a chi-square curve?
5. Is it more likely the df is 90, 20, or two in the graph?
Decide whether the following statements are true or false.
6. As the number of degrees of freedom increases, the graph of the chi-square distribution looks more and more symmetrical.
7. The standard deviation of the chi-square distribution is twice the mean.
8. The mean and the median of the chi-square distribution are the same if df = 24.
Goodness-of-Fit Test
Determine the appropriate test to be used in the next three exercises.
9. An archeologist is calculating the distribution of the frequency of the number of artifacts she finds in a dig site. Based on previous digs, the archeologist creates an expected distribution broken down by grid sections in the dig site. Once the site has been fully excavated, she compares the actual number of artifacts found in each grid section to see if her expectation was accurate.
10. An economist is deriving a model to predict outcomes on the stock market. He creates a list of expected points on the stock market index for the next two weeks. At the close of each day’s trading, he records the actual points on the index. He wants to see how well his model matched what actually happened.
11. A personal trainer is putting together a weight-lifting program for her clients. For a 90-day program, she expects each client to lift a specific maximum weight each week. As she goes along, she records the actual maximum weights her clients lifted. She wants to know how well her expectations met with what was observed.
Use the following information to answer the next five exercises: A teacher predicts that the distribution of grades on the final exam will be and they are recorded in the table.
| Grade | Proportion |
|---|---|
| A | 0.25 |
| B | 0.30 |
| C | 0.35 |
| D | 0.10 |
The actual distribution for a class of 20 is in the table below.
| Grade | Frequency |
|---|---|
| A | 7 |
| B | 7 |
| C | 5 |
| D | 1 |
12. df= ______
13. State the null and alternative hypotheses.
14. χ2 test statistic = ______
15. p-value = ______
16. At the 5% significance level, what can you conclude?
| Ethnicity | Number of Cases |
|---|---|
| White | 2,229 |
| Hispanic | 1,157 |
| Black/African-American | 457 |
| Asian, Pacific Islander | 232 |
| Total = 4,075 |
The percentage of each ethnic group in Santa Clara County is as inthe table below.
| Ethnicity | Percentage of total county population | Number expected (round to two decimal places) |
|---|---|---|
| White | 42.9% | 1748.18 |
| Hispanic | 26.7% | |
| Black/African-American | 2.6% | |
| Asian, Pacific Islander | 27.8% | |
| Total = 100% |
17. If the ethnicities of AIDS victims followed the ethnicities of the total county population, fill in the expected number of cases per ethnic group.Perform a goodness-of-fit test to determine whether the occurrence of AIDS cases follows the ethnicities of the general population of Santa Clara County.
18. H0: _______
19. Ha: _______
20. Is this a right-tailed, left-tailed, or two-tailed test?
21. degrees of freedom = _______
22. χ2 test statistic = _______
23. p-value = _______
24. Graph the situation. Label and scale the horizontal axis. Mark the mean and test statistic. Shade in the region corresponding to the p-value.

Let α = 0.05
- Decision: ________________
- Reason for the Decision: ________________
- Conclusion (write out in complete sentences): ________________
25. Does it appear that the pattern of AIDS cases in Santa Clara County corresponds to the distribution of ethnic groups in this county? Why or why not?
For each problem, use a solution sheet to solve the hypothesis test problem. Go to Appendix E for the chi-square solution sheet. Round expected frequency to two decimal places.
26. A six-sided die is rolled 120 times. Fill in the expected frequency column. Then, conduct a hypothesis test to determine if the die is fair. The data in the table below are the result of the 120 rolls.
| Face Value | Frequency | Expected Frequency |
|---|---|---|
| 1 | 15 | |
| 2 | 29 | |
| 3 | 16 | |
| 4 | 15 | |
| 5 | 30 | |
| 6 | 15 |
27. The marital status distribution of the U.S. male population, ages 15 and older, is as shown in the table below.
| Marital Status | Percent | Expected Frequency |
|---|---|---|
| never married | 31.3 | |
| married | 56.1 | |
| widowed | 2.5 | |
| divorced/separated | 10.1 |
Suppose that a random sample of 400 U.S. young adult males, 18 to 24 years old, yielded the following frequency distribution. We are interested in whether this age group of males fits the distribution of the U.S. adult population. Calculate the frequency one would expect when surveying 400 people. Fill in the table, rounding to two decimal places.
| Marital Status | Frequency |
|---|---|
| never married | 140 |
| married | 238 |
| widowed | 2 |
| divorced/separated | 20 |
Use the following information to answer the next two exercises: The columns in the table below contain the Race/Ethnicity of U.S. Public Schools for a recent year, the percentages for the Advanced Placement Examinee Population for that class, and the Overall Student Population. Suppose the right column contains the result of a survey of 1,000 local students from that year who took an AP Exam.
| Race/Ethnicity | AP Examinee Population | Overall Student Population | Survey Frequency |
|---|---|---|---|
| Asian, Asian American, or Pacific Islander | 10.2% | 5.4% | 113 |
| Black or African-American | 8.2% | 14.5% | 94 |
| Hispanic or Latino | 15.5% | 15.9% | 136 |
| American Indian or Alaska Native | 0.6% | 1.2% | 10 |
| White | 59.4% | 61.6% | 604 |
| Not reported/other | 6.1% | 1.4% | 43 |
28. Perform a goodness-of-fit test to determine whether the local results follow the distribution of the U.S. overall student population based on ethnicity.
29. Perform a goodness-of-fit test to determine whether the local results follow the distribution of U.S. AP examinee population, based on ethnicity.
30. The City of South Lake Tahoe, CA, has an Asian population of 1,419 people, out of a total population of 23,609. Suppose that a survey of 1,419 self-reported Asians in the Manhattan, NY, area yielded the data in the table below. Conduct a goodness-of-fit test to determine if the self-reported sub-groups of Asians in the Manhattan area fit that of the Lake Tahoe area.
| Race | Lake Tahoe Frequency | Manhattan Frequency |
|---|---|---|
| Asian Indian | 131 | 174 |
| Chinese | 118 | 557 |
| Filipino | 1,045 | 518 |
| Japanese | 80 | 54 |
| Korean | 12 | 29 |
| Vietnamese | 9 | 21 |
| Other | 24 | 66 |
Use the following information to answer the next two exercises: UCLA conducted a survey of more than 263,000 college freshmen from 385 colleges in fall 2005. The results of students’ expected majors by gender were reported in The Chronicle of Higher Education (2/2/2006). Suppose a survey of 5,000 graduating females and 5,000 graduating males was done as a follow-up last year to determine what their actual majors were. The results are shown in the tables below. The second column in each table does not add to 100% because of rounding.
31. Conduct a goodness-of-fit test to determine if the actual college majors of graduating females fit the distribution of their expected majors.
| Major | Women – Expected Major | Women – Actual Major |
|---|---|---|
| Arts & Humanities | 14.0% | 670 |
| Biological Sciences | 8.4% | 410 |
| Business | 13.1% | 685 |
| Education | 13.0% | 650 |
| Engineering | 2.6% | 145 |
| Physical Sciences | 2.6% | 125 |
| Professional | 18.9% | 975 |
| Social Sciences | 13.0% | 605 |
| Technical | 0.4% | 15 |
| Other | 5.8% | 300 |
| Undecided | 8.0% | 420 |
32. Conduct a goodness-of-fit test to determine if the actual college majors of graduating males fit the distribution of their expected majors.
| Major | Men – Expected Major | Men – Actual Major |
|---|---|---|
| Arts & Humanities | 11.0% | 600 |
| Biological Sciences | 6.7% | 330 |
| Business | 22.7% | 1130 |
| Education | 5.8% | 305 |
| Engineering | 15.6% | 800 |
| Physical Sciences | 3.6% | 175 |
| Professional | 9.3% | 460 |
| Social Sciences | 7.6% | 370 |
| Technical | 1.8% | 90 |
| Other | 8.2% | 400 |
| Undecided | 6.6% | 340 |
Read the statement and decide whether it is true or false.
33. In a goodness-of-fit test, the expected values are the values we would expect if the null hypothesis were true.
34. In general, if the observed values and expected values of a goodness-of-fit test are not close together, then the test statistic can get very large and on a graph will be way out in the right tail.
35. Use a goodness-of-fit test to determine if high school principals believe that students are absent equally during the week or not.
36. The test to use to determine if a six-sided die is fair is a goodness-of-fit test.
37. In a goodness-of fit test, if the p-value is 0.0113, in general, do not reject the null hypothesis.
38. A sample of 212 commercial businesses was surveyed for recycling one commodity; a commodity here means any one type of recyclable material such as plastic or aluminum. the table below shows the business categories in the survey, the sample size of each category, and the number of businesses in each category that recycle one commodity. Based on the study, on average half of the businesses were expected to be recycling one commodity. As a result, the last column shows the expected number of businesses in each category that recycle one commodity. At the 5% significance level, perform a hypothesis test to determine if the observed number of businesses that recycle one commodity follows the uniform distribution of the expected values.
| Business Type | Number in class | Observed Number that recycle one commodity | Expected number that recycle one commodity |
|---|---|---|---|
| Office | 35 | 19 | 17.5 |
| Retail/Wholesale | 48 | 27 | 24 |
| Food/Restaurants | 53 | 35 | 26.5 |
| Manufacturing/Medical | 52 | 21 | 26 |
| Hotel/Mixed | 24 | 9 | 12 |
39. The table below contains information from a survey among 499 participants classified according to their age groups. The second column shows the percentage of obese people per age class among the study participants. The last column comes from a different study at the national level that shows the corresponding percentages of obese people in the same age classes in the USA. Perform a hypothesis test at the 5% significance level to determine whether the survey participants are a representative sample of the USA obese population.
| Age Class (Years) | Obese (Percentage) | Expected USA average (Percentage) |
|---|---|---|
| 20–30 | 75.0 | 32.6 |
| 31–40 | 26.5 | 32.6 |
| 41–50 | 13.6 | 36.6 |
| 51–60 | 21.9 | 36.6 |
| 61–70 | 21.0 | 39.7 |
Test of Independence
Determine the appropriate test to be used in the next three exercises.
40. A pharmaceutical company is interested in the relationship between age and presentation of symptoms for a common viral infection. A random sample is taken of 500 people with the infection across different age groups.
41. The owner of a baseball team is interested in the relationship between player salaries and team winning percentage. He takes a random sample of 100 players from different organizations.
42. A marathon runner is interested in the relationship between the brand of shoes runners wear and their run times. She takes a random sample of 50 runners and records their run times as well as the brand of shoes they were wearing.
| Traveling Distance | Third class | Second class | First class | Total |
|---|---|---|---|---|
| 1–100 miles | 21 | 14 | 6 | 41 |
| 101–200 miles | 18 | 16 | 8 | 42 |
| 201–300 miles | 16 | 17 | 15 | 48 |
| 301–400 miles | 12 | 14 | 21 | 47 |
| 401–500 miles | 6 | 6 | 10 | 22 |
| Total | 73 | 67 | 60 | 200 |
43. State the hypotheses.
46. df = _______
47. How many passengers are expected to travel between 201 and 300 miles and purchase second-class tickets?
48. How many passengers are expected to travel between 401 and 500 miles and purchase first-class tickets?
49. What is the test statistic?
50. What is the p-value?
52. Complete the table.
| Smoking Level Per Day | African American | Native Hawaiian | Latino | Japanese Americans | White | TOTALS |
|---|---|---|---|---|---|---|
| 1-10 | ||||||
| 11-20 | ||||||
| 21-30 | ||||||
| 31+ | ||||||
| TOTALS |
53. State the hypotheses.
56. Enter expected values in the table. Round to two decimal places.
Calculate the following values:
57. df = _______
58. χ2 test statistic = ______
59. p-value = ______
60. Is this a right-tailed, left-tailed, or two-tailed test? Explain why.

62. State the decision and conclusion (in a complete sentence) for the following preconceived levels of α.
α = 0.05
- Decision: ___________________
- Reason for the decision: ___________________
- Conclusion (write out in a complete sentence): ___________________
63. α = 0.01
- Decision: ___________________
- Reason for the decision: ___________________
- Conclusion (write out in a complete sentence): ___________________
For each problem, use a solution sheet to solve the hypothesis test problem. Go to Appendix E for the chi-square solution sheet. Round expected frequency to two decimal places.
64. A recent debate about where in the United States skiers believe the skiing is best prompted the following survey. Test to see if the best ski area is independent of the level of the skier.
| U.S. Ski Area | Beginner | Intermediate | Advanced |
|---|---|---|---|
| Tahoe | 20 | 30 | 40 |
| Utah | 10 | 30 | 60 |
| Colorado | 10 | 40 | 50 |
65. Car manufacturers are interested in whether there is a relationship between the size of car an individual drives and the number of people in the driver’s family (that is, whether car size and family size are independent). To test this, suppose that 800 car owners were randomly surveyed with the results in the table. Conduct a test of independence.
| Family Size | Sub & Compact | Mid-size | Full-size | Van & Truck |
|---|---|---|---|---|
| 1 | 20 | 35 | 40 | 35 |
| 2 | 20 | 50 | 70 | 80 |
| 3–4 | 20 | 50 | 100 | 90 |
| 5+ | 20 | 30 | 70 | 70 |
66. College students may be interested in whether or not their majors have any effect on starting salaries after graduation. Suppose that 300 recent graduates were surveyed as to their majors in college and their starting salaries after graduation. The table below shows the data. Conduct a test of independence.
| Major | < $50,000 | $50,000 – $68,999 | $69,000 + |
|---|---|---|---|
| English | 5 | 20 | 5 |
| Engineering | 10 | 30 | 60 |
| Nursing | 10 | 15 | 15 |
| Business | 10 | 20 | 30 |
| Psychology | 20 | 30 | 20 |
67. Some travel agents claim that honeymoon hot spots vary according to age of the bride. Suppose that 280 recent brides were interviewed as to where they spent their honeymoons. The information is given in Table. Conduct a test of independence.
| Location | 20–29 | 30–39 | 40–49 | 50 and over |
|---|---|---|---|---|
| Niagara Falls | 15 | 25 | 25 | 20 |
| Poconos | 15 | 25 | 25 | 10 |
| Europe | 10 | 25 | 15 | 5 |
| Virgin Islands | 20 | 25 | 15 | 5 |
68. A manager of a sports club keeps information concerning the main sport in which members participate and their ages. To test whether there is a relationship between the age of a member and his or her choice of sport, 643 members of the sports club are randomly selected. Conduct a test of independence.
| Sport | 18 – 25 | 26 – 30 | 31 – 40 | 41 and over |
|---|---|---|---|---|
| racquetball | 42 | 58 | 30 | 46 |
| tennis | 58 | 76 | 38 | 65 |
| swimming | 72 | 60 | 65 | 33 |
69. A major food manufacturer is concerned that the sales for its skinny french fries have been decreasing. As a part of a feasibility study, the company conducts research into the types of fries sold across the country to determine if the type of fries sold is independent of the area of the country. The results of the study are shown in the table. Conduct a test of independence.
| Type of Fries | Northeast | South | Central | West |
|---|---|---|---|---|
| skinny fries | 70 | 50 | 20 | 25 |
| curly fries | 100 | 60 | 15 | 30 |
| steak fries | 20 | 40 | 10 | 10 |
70. According to Dan Lenard, an independent insurance agent in the Buffalo, N.Y. area, the following is a breakdown of the amount of life insurance purchased by males in the following age groups. He is interested in whether the age of the male and the amount of life insurance purchased are independent events. Conduct a test for independence.
| Age of Males | None | < $200,000 | $200,000–$400,000 | $401,001–$1,000,000 | $1,000,001+ |
|---|---|---|---|---|---|
| 20–29 | 40 | 15 | 40 | 0 | 5 |
| 30–39 | 35 | 5 | 20 | 20 | 10 |
| 40–49 | 20 | 0 | 30 | 0 | 30 |
| 50+ | 40 | 30 | 15 | 15 | 10 |
71. Suppose that 600 thirty-year-olds were surveyed to determine whether or not there is a relationship between the level of education an individual has and salary. Conduct a test of independence.
| Annual Salary | Not a high school graduate | High school graduate | College graduate | Masters or doctorate |
|---|---|---|---|---|
| < $30,000 | 15 | 25 | 10 | 5 |
| $30,000–$40,000 | 20 | 40 | 70 | 30 |
| $40,000–$50,000 | 10 | 20 | 40 | 55 |
| $50,000–$60,000 | 5 | 10 | 20 | 60 |
| $60,000+ | 0 | 5 | 10 | 150 |
Read the statement and decide whether it is true or false.
72. The number of degrees of freedom for a test of independence is equal to the sample size minus one.
73. The test for independence uses tables of observed and expected data values.
74. The test to use when determining if the college or university a student chooses to attend is related to his or her socioeconomic status is a test for independence.
75. In a test of independence, the expected number is equal to the row total multiplied by the column total divided by the total surveyed.
| U.S. region/Flavor | Strawberry | Chocolate | Vanilla | Rocky Road | Mint Chocolate Chip | Pistachio | Row total |
|---|---|---|---|---|---|---|---|
| West | 12 | 21 | 22 | 19 | 15 | 8 | 97 |
| Midwest | 10 | 32 | 22 | 11 | 15 | 6 | 96 |
| East | 8 | 31 | 27 | 8 | 15 | 7 | 96 |
| South | 15 | 28 | 30 | 8 | 15 | 6 | 102 |
| Column Total | 45 | 112 | 101 | 46 | 60 | 27 | 391 |
77. The table provides a recent survey of the youngest online entrepreneurs whose net worth is estimated at one million dollars or more. Their ages range from 17 to 30. Each cell in the table illustrates the number of entrepreneurs who correspond to the specific age group and their net worth. Are the ages and net worth independent? Perform a test of independence at the 5% significance level.
| Age Group\ Net Worth Value (in millions of US dollars) | 1–5 | 6–24 | ≥25 | Row Total |
|---|---|---|---|---|
| 17–25 | 8 | 7 | 5 | 20 |
| 26–30 | 6 | 5 | 9 | 20 |
| Column Total | 14 | 12 | 14 | 40 |
78. A 2013 poll in California surveyed people about taxing sugar-sweetened beverages. The results are presented in the table, and are classified by ethnic group and response type. Are the poll responses independent of the participants’ ethnic group? Conduct a test of independence at the 5% significance level.
| Opinion/Ethnicity | Asian-American | White/Non-Hispanic | African-American | Latino | Row Total |
|---|---|---|---|---|---|
| Against tax | 48 | 433 | 41 | 160 | 628 |
| In Favor of tax | 54 | 234 | 24 | 147 | 459 |
| No opinion | 16 | 43 | 16 | 19 | 84 |
| Column Total | 118 | 710 | 71 | 272 | 1171 |
Test for Homogeneity
79. A math teacher wants to see if two of her classes have the same distribution of test scores. What test should she use?
81. A market researcher wants to see if two different stores have the same distribution of sales throughout the year. What type of test should he use?
83. What condition must be met to use the test for homogeneity?
Use the following information to answer the next five exercises: Do private practice doctors and hospital doctors have the same distribution of working hours? Suppose that a sample of 100 private practice doctors and 150 hospital doctors are selected at random and asked about the number of hours a week they work. The results are shown in the table.
| 20–30 | 30–40 | 40–50 | 50–60 | |
|---|---|---|---|---|
| Private Practice | 16 | 40 | 38 | 6 |
| Hospital | 8 | 44 | 59 | 39 |
84. State the null and alternative hypotheses.
85. df = _______
86. What is the test statistic?
87. What is the p-value?
88. What can you conclude at the 5% significance level?
For each word problem, use a solution sheet to solve the hypothesis test problem. Go to Appendix E for the chi-square solution sheet. Round expected frequency to two decimal places.
89. A psychologist is interested in testing whether there is a difference in the distribution of personality types for business majors and social science majors. The results of the study are shown in the table. Conduct a test of homogeneity. Test at a 5% level of significance.
| Open | Conscientious | Extrovert | Agreeable | Neurotic | |
| Business | 41 | 52 | 46 | 61 | 58 |
| Social Science | 72 | 75 | 63 | 80 | 65 |
90. Do men and women select different breakfasts? The breakfasts ordered by randomly selected men and women at a popular breakfast place is shown in the table. Conduct a test for homogeneity at a 5% level of significance.
| French Toast | Pancakes | Waffles | Omelettes | |
| Men | 47 | 35 | 28 | 53 |
| Women | 65 | 59 | 55 | 60 |
91. A fisherman is interested in whether the distribution of fish caught in Green Valley Lake is the same as the distribution of fish caught in Echo Lake. Of the 191 randomly selected fish caught in Green Valley Lake, 105 were rainbow trout, 27 were other trout, 35 were bass, and 24 were catfish. Of the 293 randomly selected fish caught in Echo Lake, 115 were rainbow trout, 58 were other trout, 67 were bass, and 53 were catfish. Perform a test for homogeneity at a 5% level of significance.
92. In 2007, the United States had 1.5 million homeschooled students, according to the U.S. National Center for Education Statistics. In the table below you can see that parents decide to homeschool their children for different reasons, and some reasons are ranked by parents as more important than others. According to the survey results shown in the table, is the distribution of applicable reasons the same as the distribution of the most important reason? Provide your assessment at the 5% significance level. Did you expect the result you obtained?
| Reasons for Homeschooling | Applicable Reason (in thousands of respondents) | Most Important Reason (in thousands of respondents) | Row Total |
|---|---|---|---|
| Concern about the environment of other schools | 1,321 | 309 | 1,630 |
| Dissatisfaction with academic instruction at other schools | 1,096 | 258 | 1,354 |
| To provide religious or moral instruction | 1,257 | 540 | 1,797 |
| Child has special needs, other than physical or mental | 315 | 55 | 370 |
| Nontraditional approach to child’s education | 984 | 99 | 1,083 |
| Other reasons (e.g., finances, travel, family time, etc.) | 485 | 216 | 701 |
| Column Total | 5,458 | 1,477 | 6,935 |
93. When looking at energy consumption, we are often interested in detecting trends over time and how they correlate among different countries. The information in the table shows the average energy use (in units of kg of oil equivalent per capita) in the USA and the joint European Union countries (EU) for the six-year period 2005 to 2010. Do the energy use values in these two areas come from the same distribution? Perform the analysis at the 5% significance level.
| Year | European Union | United States | Row Total |
|---|---|---|---|
| 2010 | 3,413 | 7,164 | 10,557 |
| 2009 | 3,302 | 7,057 | 10,359 |
| 2008 | 3,505 | 7,488 | 10,993 |
| 2007 | 3,537 | 7,758 | 11,295 |
| 2006 | 3,595 | 7,697 | 11,292 |
| 2005 | 3,613 | 7,847 | 11,460 |
| Column Total | 45,011 | 20,965 | 65,976 |
94. The Insurance Institute for Highway Safety collects safety information about all types of cars every year, and publishes a report of Top Safety Picks among all cars, makes, and models. The table below presents the number of Top Safety Picks in six car categories for the two years 2009 and 2013. Analyze the table data to conclude whether the distribution of cars that earned the Top Safety Picks safety award has remained the same between 2009 and 2013. Derive your results at the 5% significance level.
| Year \ Car Type | Small | Mid-Size | Large | Small SUV | Mid-Size SUV | Large SUV | Row Total |
|---|---|---|---|---|---|---|---|
| 2009 | 12 | 22 | 10 | 10 | 27 | 6 | 87 |
| 2013 | 31 | 30 | 19 | 11 | 29 | 4 | 124 |
| Column Total | 43 | 52 | 29 | 21 | 56 | 10 | 211 |
Comparison of the Chi-Square Tests
95. Which test do you use to decide whether an observed distribution is the same as an expected distribution?
96. What is the null hypothesis for the type of test from 90?
97. Which test would you use to decide whether two factors have a relationship?
98. Which test would you use to decide if two populations have the same distribution?
99. How are tests of independence similar to tests for homogeneity?
100. How are tests of independence different from tests for homogeneity?
For each word problem, use a solution sheet to solve the hypothesis test problem. Go to Appendix E for the chi-square solution sheet. Round expected frequency to two decimal places.
101. Is there a difference between the distribution of community college statistics students and the distribution of university statistics students in what technology they use on their homework? Of some randomly selected community college students, 43 used a computer, 102 used a calculator with built in statistics functions, and 65 used a table from the textbook. Of some randomly selected university students, 28 used a computer, 33 used a calculator with built in statistics functions, and 40 used a table from the textbook. Conduct an appropriate hypothesis test using a 0.05 level of significance.
Read the statement and decide whether it is true or false.
102. If df = 2, the chi-square distribution has a shape that reminds us of the exponential.
103.
- Explain why a goodness-of-fit test and a test of independence are generally right-tailed tests.
- If you did a left-tailed test, what would you be testing?
Test of a Single Variance
Use the following information to answer the next three exercises: An archer’s standard deviation for his hits is six (data is measured in distance from the center of the target). An observer claims the standard deviation is less.
104. What type of test should be used?
106. Is this a right-tailed, left-tailed, or two-tailed test?
Use the following information to answer the next three exercises: The standard deviation of heights for students in a school is 0.81. A random sample of 50 students is taken, and the standard deviation of heights of the sample is 0.96. A researcher in charge of the study believes the standard deviation of heights for the school is greater than 0.81.
107. What type of test should be used?
108. State the null and alternative hypotheses.
110. What type of test should be used?
112. What is the p-value?
Use the following information to answer the next twelve exercises: Suppose an airline claims that its flights are consistently on time with an average delay of at most 15 minutes. It claims that the average delay is so consistent that the variance is no more than 150 minutes. Doubting the consistency part of the claim, a disgruntled traveler calculates the delays for his next 25 flights. The average delay for those 25 flights is 22 minutes with a standard deviation of 15 minutes.
114. Is the traveler disputing the claim about the average or about the variance?
115. A sample standard deviation of 15 minutes is the same as a sample variance of __________ minutes.
117. H0: __________
118. df = ________
119. chi-square test statistic = ________
120. p-value = ________
121. Graph the situation. Label and scale the horizontal axis. Mark the mean and test statistic. Shade the p-value.
122. Let α = 0.05
- Decision: ________
- Conclusion (write out in a complete sentence.): ________
123. How did you know to test the variance instead of the mean?
124. If an additional test were done on the claim of the average delay, which distribution would you use?
125. If an additional test were done on the claim of the average delay, but 45 flights were surveyed, which distribution would you use?
For each word problem, use a solution sheet to solve the hypothesis test problem. Go to Appendix E for the chi-square solution sheet. Round expected frequency to two decimal places.
126. A plant manager is concerned her equipment may need recalibrating. It seems that the actual weight of the 15 oz. cereal boxes it fills has been fluctuating. The standard deviation should be at most 0.5 oz. In order to determine if the machine needs to be recalibrated, 84 randomly selected boxes of cereal from the next day’s production were weighed. The standard deviation of the 84 boxes was 0.54. Does the machine need to be recalibrated?
127. Consumers may be interested in whether the cost of a particular calculator varies from store to store. Based on surveying 43 stores, which yielded a sample mean of $84 and a sample standard deviation of $12, test the claim that the standard deviation is greater than $15.
128. Isabella, an accomplished Bay to Breakers runner, claims that the standard deviation for her time to run the 7.5 mile race is at most three minutes. To test her claim, Rupinder looks up five of her race times. They are 55 minutes, 61 minutes, 58 minutes, 63 minutes, and 57 minutes.
129. Airline companies are interested in the consistency of the number of babies on each flight, so that they have adequate safety equipment. They are also interested in the variation of the number of babies. Suppose that an airline executive believes the average number of babies on flights is six with a variance of nine at most. The airline conducts a survey. The results of the 18 flights surveyed give a sample average of 6.4 with a sample standard deviation of 3.9. Conduct a hypothesis test of the airline executive’s belief.
130. The number of births per woman in China is 1.6 down from 5.91 in 1966. This fertility rate has been attributed to the law passed in 1979 restricting births to one per woman. Suppose that a group of students studied whether or not the standard deviation of births per woman was greater than 0.75. They asked 50 women across China the number of births they had had. The results are shown in the table below. Does the students’ survey indicate that the standard deviation is greater than 0.75?
| # of births | Frequency |
|---|---|
| 0 | 5 |
| 1 | 30 |
| 2 | 10 |
| 3 | 5 |
131. According to an avid aquarist, the average number of fish in a 20-gallon tank is 10, with a standard deviation of two. His friend, also an aquarist, does not believe that the standard deviation is two. She counts the number of fish in 15 other 20-gallon tanks. Based on the results that follow, do you think that the standard deviation is different from two? Data: 11; 10; 9; 10; 10; 11; 11; 10; 12; 9; 7; 9; 11; 10; 11
132. The manager of “Frenchies” is concerned that patrons are not consistently receiving the same amount of French fries with each order. The chef claims that the standard deviation for a ten-ounce order of fries is at most 1.5 oz., but the manager thinks that it may be higher. He randomly weighs 49 orders of fries, which yields a mean of 11 oz. and a standard deviation of two oz.
133. You want to buy a specific computer. A sales representative of the manufacturer claims that retail stores sell this computer at an average price of $1,249 with a very narrow standard deviation of $25. You find a website that has a price comparison for the same computer at a series of stores as follows: $1,299; $1,229.99; $1,193.08; $1,279; $1,224.95; $1,229.99; $1,269.95; $1,249. Can you argue that pricing has a larger standard deviation than claimed by the manufacturer? Use the 5% significance level. As a potential buyer, what would be the practical conclusion from your analysis?
134. A company packages apples by weight. One of the weight grades is Class A apples. Class A apples have a mean weight of 150 g, and there is a maximum allowed weight tolerance of 5% above or below the mean for apples in the same consumer package. A batch of apples is selected to be included in a Class A apple package. Given the following apple weights of the batch, does the fruit comply with the Class A grade weight tolerance requirements. Conduct an appropriate hypothesis test.
(a) at the 5% significance level
(b) at the 1% significance level
Weights in selected apple batch (in grams): 158; 167; 149; 169; 164; 139; 154; 150; 157; 171; 152; 161; 141; 166; 172;
Candela Citations
- Introductory Statistics . Authored by: Barbara Illowski, Susan Dean. Provided by: Open Stax. Located at: http://cnx.org/contents/30189442-6998-4686-ac05-ed152b91b9de@17.44. License: CC BY: Attribution. License Terms: Download for free at http://cnx.org/contents/30189442-6998-4686-ac05-ed152b91b9de@17.44