Definitions of Statistics, Probability, and Key Terms
Use the following information to answer the next five exercises. Studies are often done by pharmaceutical companies to determine the effectiveness of a treatment program. Suppose that a new AIDS antibody drug is currently under study. It is given to patients once the AIDS symptoms have revealed themselves. Of interest is the average (mean) length of time in months patients live once they start the treatment. Two researchers each follow a different set of [latex]40[/latex] patients with AIDS from the start of treatment until their deaths. The following data (in months) are collected.
Researcher A: [latex]3[/latex] [latex]4[/latex] [latex]11[/latex] [latex]15[/latex] [latex]16[/latex] [latex]17[/latex] [latex]22[/latex] [latex]44[/latex] [latex]37[/latex] [latex]16[/latex] [latex]14[/latex] [latex]24[/latex] [latex]25[/latex] [latex]15[/latex] [latex]26[/latex] [latex]27[/latex] [latex]33[/latex] [latex]29[/latex] [latex]35[/latex] [latex]44[/latex] [latex]13[/latex] [latex]21[/latex] [latex]22[/latex] [latex]10[/latex] [latex]12[/latex] [latex]8[/latex] [latex]40[/latex] [latex]32[/latex] [latex]26[/latex] [latex]27[/latex] [latex]31[/latex] [latex]34[/latex] [latex]29[/latex] [latex]17[/latex] [latex]8[/latex] [latex]24[/latex] [latex]18[/latex] [latex]47[/latex] [latex]33[/latex] [latex]34[/latex]
Researcher B: [latex]3[/latex] [latex]14[/latex] [latex]11[/latex] [latex]5[/latex] [latex]16[/latex] [latex]17[/latex] [latex]28[/latex] [latex]41[/latex] [latex]31[/latex] [latex]18[/latex] [latex]14[/latex] [latex]14[/latex] [latex]26[/latex] [latex]25[/latex] [latex]121[/latex] [latex]22[/latex] [latex]31[/latex] [latex]2[/latex] [latex]35[/latex] [latex]44[/latex] [latex]23[/latex] [latex]21[/latex] [latex]21[/latex] [latex]16[/latex] [latex]12[/latex] [latex]18[/latex] [latex]41[/latex] [latex]22[/latex] [latex]16[/latex] [latex]25[/latex] [latex]33[/latex] [latex]34[/latex] [latex]29[/latex] [latex]13[/latex] [latex]18[/latex] [latex]24[/latex] [latex]23[/latex] [latex]42[/latex] [latex]33[/latex] [latex]29[/latex]
Determine what the key terms refer to in the example for Researcher A.
For each of the following eight exercises, identify: a. the population, b. the sample, c. the parameter, d. the statistic, e. the variable, and f. the data. Give examples where appropriate.
8. A cardiologist is interested in the mean recovery period of her patients who have had heart attacks.
10. A politician is interested in the proportion of voters in his district who think he is doing a good job.
12. Political pollsters may be interested in the proportion of people who will vote for a particular cause.
Use the following information to answer the next three exercises: A Lake Tahoe Community College instructor is interested in the mean number of days Lake Tahoe Community College math students are absent from class during a quarter.
14. What is the population she is interested in?
- all Lake Tahoe Community College students
- all Lake Tahoe Community College English students
- all Lake Tahoe Community College students in her classes
- all Lake Tahoe Community College math students
15. In this case, [latex]X[/latex] is an example of a:
- variable.
- population.
- statistic.
- data.
- parameter.
- data.
- statistic.
- variable.
Data, Sampling, and Variation in Data and Sampling
a. qualitative
b. quantitative discrete
c. quantitative continuous
Use the following information to answer the next four exercises: A study was done to determine the age, number of times per week, and the duration (amount of time) of residents using a local park in San Antonio, Texas. The first house in the neighborhood around the park was selected randomly, and then the resident of every eighth house in the neighborhood around the park was interviewed.
a. simple random
b. systematic
c. stratified
d. cluster
19. “Duration (amount of time)” is what type of data?
b. quantitative discrete
c. quantitative continuous
a. qualitative
b. quantitative discrete
c. quantitative continuous
| Year | Total Number of Deaths |
|---|---|
| 2000 | [latex]231[/latex] |
| 2001 | [latex]21,357[/latex] |
| 2002 | [latex]11,685[/latex] |
| 2003 | [latex]33,819[/latex] |
| 2004 | [latex]228,802[/latex] |
| 2005 | [latex]88,003[/latex] |
| 2006 | [latex]6,605[/latex] |
| 2007 | [latex]712[/latex] |
| 2008 | [latex]88,011[/latex] |
| 2009 | [latex]1,790[/latex] |
| 2010 | [latex]320,120[/latex] |
| 2011 | [latex]21,953[/latex] |
| 2012 | [latex]768[/latex] |
| Total | [latex]823,856[/latex] |
22. Use the table to answer the following questions.
- What is the proportion of deaths between 2007 and 2012?
- What percent of deaths occurred before 2001?
- What is the percent of deaths that occurred in 2003 or after 2010?
- What is the fraction of deaths that happened before 2012?
- What kind of data is the number of deaths?
- Earthquakes are quantified according to the amount of energy they produce (examples are [latex]2.1[/latex], [latex]5.0[/latex], [latex]6.7[/latex]). What type of data is that?
- What contributed to the large number of deaths in 2010? In 2004? Explain.
For the following four exercises, determine the type of sampling used (simple random, stratified, systematic, cluster, or convenience).
Researcher A: [latex]3[/latex]; [latex]4[/latex]; [latex]11[/latex]; [latex]15[/latex]; [latex]16[/latex]; [latex]17[/latex]; [latex]22[/latex]; [latex]44[/latex]; [latex]37[/latex]; [latex]16[/latex]; [latex]14[/latex]; [latex]24[/latex]; [latex]25[/latex]; [latex]15[/latex]; [latex]26[/latex]; [latex]27[/latex]; [latex]33[/latex]; [latex]29[/latex]; [latex]35[/latex]; [latex]44[/latex]; [latex]13[/latex]; [latex]21[/latex]; [latex]22[/latex]; [latex]10[/latex]; [latex]12[/latex]; [latex]8[/latex]; [latex]40[/latex]; [latex]32[/latex]; [latex]26[/latex]; [latex]27[/latex]; [latex]31[/latex]; [latex]34[/latex]; [latex]29[/latex]; [latex]17[/latex]; [latex]8[/latex]; [latex]24[/latex]; [latex]18[/latex]; [latex]47[/latex]; [latex]33[/latex]; [latex]34[/latex]
Researcher B: [latex]3[/latex]; [latex]14[/latex]; [latex]11[/latex]; [latex]5[/latex]; [latex]16[/latex]; [latex]17[/latex]; [latex]28[/latex]; [latex]41[/latex]; [latex]31[/latex]; [latex]18[/latex]; [latex]14[/latex]; [latex]14[/latex]; [latex]26[/latex]; [latex]25[/latex]; [latex]21[/latex]; [latex]22[/latex]; [latex]31[/latex]; [latex]2[/latex]; [latex]35[/latex]; [latex]44[/latex]; [latex]23[/latex]; [latex]21[/latex]; [latex]21[/latex]; [latex]16[/latex]; [latex]12[/latex]; [latex]18[/latex]; [latex]41[/latex]; [latex]22[/latex]; [latex]16[/latex]; [latex]25[/latex]; [latex]33[/latex]; [latex]34[/latex]; [latex]29[/latex]; [latex]13[/latex]; [latex]18[/latex]; [latex]24[/latex]; [latex]23[/latex]; [latex]42[/latex]; [latex]33[/latex]; [latex]29[/latex]
| Survival Length (in months) | Frequency | Relative Frequency | Cumulative Relative Frequency |
|---|---|---|---|
| [latex]0.5–6.5[/latex] | |||
| [latex]6.5–12.5[/latex] | |||
| [latex]12.5–18.5[/latex] | |||
| [latex]18.5–24.5[/latex] | |||
| [latex]24.5–30.5[/latex] | |||
| [latex]30.5–36.5[/latex] | |||
| [latex]36.5–42.5[/latex] | |||
| [latex]42.5–48.5[/latex] |
| Survival Length (in months) | Frequency | Relative Frequency | Cumulative Relative Frequency |
|---|---|---|---|
| [latex]0.5–6.5[/latex] | |||
| [latex]6.5–12.5[/latex] | |||
| [latex]12.5–18.5[/latex] | |||
| [latex]18.5–24.5[/latex] | |||
| [latex]24.5–30.5[/latex] | |||
| [latex]30.5–36.5[/latex] | |||
| [latex]36.5-45.5[/latex] |
Use the following data to answer the next five exercises: Two researchers are gathering data on hours of video games played by school-aged children and young adults. They each randomly sample different groups of [latex]150[/latex] students from the same school. They collect the following data.
| Hours Played per Week | Frequency | Relative Frequency | Cumulative Relative Frequency |
|---|---|---|---|
| 0–2 | [latex]26[/latex] | [latex]0.17[/latex] | [latex]0.17[/latex] |
| 2–4 | [latex]30[/latex] | [latex]0.20[/latex] | [latex]0.37[/latex] |
| 4–6 | [latex]49[/latex] | [latex]0.33[/latex] | [latex]0.70[/latex] |
| 6–8 | [latex]25[/latex] | [latex]0.17[/latex] | [latex]0.87[/latex] |
| 8–10 | [latex]12[/latex] | [latex]0.08[/latex] | [latex]0.95[/latex] |
| 10–12 | [latex]8[/latex] | [latex]0.05[/latex] | [latex]1[/latex] |
| Hours Played per Week | Frequency | Relative Frequency | Cumulative Relative Frequency |
|---|---|---|---|
| 0–2 | [latex]48[/latex] | [latex]0.32[/latex] | [latex]0.32[/latex] |
| 2–4 | [latex]51[/latex] | [latex]0.34[/latex] | [latex]0.66[/latex] |
| 4–6 | [latex]24[/latex] | [latex]0.16[/latex] | [latex]0.82[/latex] |
| 6–8 | [latex]12[/latex] | [latex]0.08[/latex] | [latex]0.90[/latex] |
| 8–10 | [latex]11[/latex] | [latex]0.07[/latex] | [latex]0.97[/latex] |
| 10–12 | [latex]4[/latex] | [latex]0.03[/latex] | [latex]1[/latex] |
Use the following data to answer the next five exercises: A pair of studies was performed to measure the effectiveness of a new software program designed to help stroke patients regain their problem-solving skills. Patients were asked to use the software program twice a day, once in the morning and once in the evening. The studies observed [latex]200[/latex] stroke patients recovering over a period of several weeks. The first study collected the data in the table. The second study collected the data in the table.
| Group | Showed improvement | No improvement | Deterioration |
|---|---|---|---|
| Used program | [latex]142[/latex] | [latex]43[/latex] | [latex]15[/latex] |
| Did not use program | [latex]72[/latex] | [latex]110[/latex] | [latex]18[/latex] |
| Group | Showed improvement | No improvement | Deterioration |
|---|---|---|---|
| Used program | [latex]105[/latex] | [latex]74[/latex] | [latex]19[/latex] |
| Did not use program | [latex]89[/latex] | [latex]99[/latex] | [latex]12[/latex] |
For the following exercises, identify the type of data that would be used to describe a response (quantitative discrete, quantitative continuous, or qualitative), and give an example of the data.
Use the following information to answer the next two exercises: A study was done to determine the age, number of times per week, and the duration (amount of time) of resident use of a local park in San Jose. The first house in the neighborhood around the park was selected randomly and then every 8th house in the neighborhood around the park was interviewed.
- qualitative
- quantitative discrete
- quantitative continuous
- qualitative
- quantitative discrete
- quantitative continuous
62. Airline companies are interested in the consistency of the number of babies on each flight, so that they have adequate safety equipment. Suppose an airline conducts a survey. Over Thanksgiving weekend, it surveys six flights from Boston to Salt Lake City to determine the number of babies on the flights. It determines the amount of safety equipment needed by the result of that study.
- Using complete sentences, list three things wrong with the way the survey was conducted.
- Using complete sentences, list three ways that you would improve the survey if it were to be repeated.
- cluster sampling
- stratified sampling
- simple random sampling
- convenience sampling
- simple random
- systematic
- stratified
- cluster
- Do you consider the sample size large enough for a study of this type? Why or why not?
- Based on your “gut feeling,” do you believe the percents accurately reflect the U.S. population for those individuals born since 1971? If not, do you think the percents of the population are actually higher or lower than the sample statistics? Why?
Additional information: The survey, reported by Intel Corporation, was filled out by individuals who visited the Los Angeles Convention Center to see the Smithsonian Institute’s road show called “America’s Smithsonian.”
- With this additional information, do you feel that all demographic and ethnic groups were equally represented at the event? Why or why not?
- With the additional information, comment on how accurately you think the sample statistics reflect the population parameters.
78. Identify the type of data obtained from each question used in this survey: qualitative, quantitative discrete, or quantitative continuous.
- Do you have any health problems that prevent you from doing any of the things people your age can normally do?
- During the past [latex]30[/latex] days, for about how many days did poor health keep you from doing your usual activities?
- In the last seven days, on how many days did you exercise for [latex]30[/latex] minutes or more?
- Do you have health insurance coverage?
- Think about the state of the United States in 1936. Explain why a sample chosen from magazine subscription lists, automobile registration lists, phone books, and club membership lists was not representative of the population of the United States at that time.
- What effect does the low response rate have on the reliability of the sample?
- Are these problems examples of sampling error or nonsampling error?
- During the same year, George Gallup conducted his own poll of [latex]30,000[/latex] prospective voters. His researchers used a method they called “quota sampling” to obtain survey answers from specific subsets of the population. Quota sampling is an example of which sampling method described in this module?
Which of the potential problems with samples discussed below could explain this connection?
“Do you feel happy paying your taxes when members of the Obama administration are allowed to ignore their tax liabilities?”
As of April 25, [latex]11[/latex] people responded to this question. Each participant answered “NO!”
81. Which of the potential problems with samples could explain this connection?
“Declining contact and cooperation rates in random digit dial (RDD) national telephone surveys raise serious concerns about the validity of estimates drawn from such research.”
The Pew Research Center for People and the Press admits:
“The percentage of people we interview – out of all we try to interview – has been declining over the past decade or more.”3
- What are some reasons for the decline in response rate over the past decade?
- Explain why researchers are concerned with the impact of the declining response rate on public opinion polls.
| Have computer at home | [latex]96[/latex]% |
| Unable to come to campus for classes | [latex]65[/latex]% |
| Age 41 or over | [latex]24[/latex]% |
| Would like LBCC to offer more DL courses | [latex]95[/latex]% |
| Took DL classes due to a disability | [latex]17[/latex]% |
| Live at least 16 miles from campus | [latex]13[/latex]% |
| Took DL courses to fulfill transfer requirements | [latex]71[/latex]% |
- What percent of the students surveyed do not have a computer at home?
- About how many students in the survey live at least [latex]16[/latex] miles from campus?
- If the same survey were done at Great Basin College in Elko, Nevada, do you think the percentages would be the same? Why?
85. A college newspaper reporter is investigating textbook availability at online retailers. He decides to investigate one textbook for each of the following seven subjects: calculus, biology, chemistry, physics, statistics, geology, and general engineering. He consults textbook industry sales data and selects the most popular nationally used textbook in each of these subjects. He visits websites for a random sample of major online textbook sellers and looks up each of these seven textbooks to see if they are available in stock for quick delivery through these retailers. Based on his investigation, he writes an article in which he draws conclusions about the overall availability of all college textbooks through online textbook retailers.
Write an analysis of his study that addresses the following issues: Is his sample representative of the population of all college textbooks? Explain why or why not. Describe some possible sources of bias in this study, and how it might affect the results of the study. Give some suggestions about what could be done to improve the study.
Frequency, Frequency Tables, and Levels of Measurement
- High school soccer players classified by their athletic ability: Superior, Average, Above average
- Baking temperatures for various main dishes: [latex]350[/latex], [latex]400[/latex], [latex]325[/latex], [latex]250[/latex], [latex]300[/latex]
- The colors of crayons in a [latex]24[/latex]-crayon box
- Social security numbers
- Incomes measured in dollars
- A satisfaction survey of a social website by number: [latex]1[/latex] = very satisfied, [latex]2[/latex] = somewhat satisfied, [latex]3[/latex] = not satisfied
- Political outlook: extreme left, left-of-center, right-of-center, extreme right
- Time of day on an analog watch
- The distance in miles to the closest grocery store
- The dates 1066, 1492, 1644, 1947, and 1944
- The heights of 21–65 year-old women
- Common letter grades: A, B, C, D, and F
| # of Courses | Frequency | Relative Frequency | Cumulative Relative Frequency |
|---|---|---|---|
| [latex]1[/latex] | [latex]30[/latex] | [latex]0.6[/latex] | |
| [latex]2[/latex] | [latex]15[/latex] | ||
| [latex]3[/latex] |
- Fill in the blanks in Table.
- What percent of students take exactly two courses?
- What percent of students take one or two courses?
| # Flossing per Week | Frequency | Relative Frequency | Cumulative Relative Freq. |
|---|---|---|---|
| [latex]0[/latex] | [latex]27[/latex] | [latex]0.4500[/latex] | |
| [latex]1[/latex] | [latex]18[/latex] | ||
| [latex]3[/latex] | [latex]0.9333[/latex] | ||
| [latex]6[/latex] | [latex]3[/latex] | [latex]0.0500[/latex] | |
| [latex]7[/latex] | [latex]1[/latex] | [latex]0.0167[/latex] |
- Fill in the blanks in Table.
- What percent of adults flossed six times per week?
- What percent flossed at most three times per week?
This table was produced.
| Data | Frequency | Relative Frequency | Cumulative Relative Frequency |
|---|---|---|---|
| [latex]0[/latex] | [latex]2[/latex] | [latex]\frac{2}{19}[/latex] | [latex]0.1053[/latex] |
| [latex]2[/latex] | [latex]3[/latex] | [latex]\frac{3}{19}[/latex] | [latex]0.2632[/latex] |
| [latex]4[/latex] | [latex]1[/latex] | [latex]\frac{1}{19}[/latex] | [latex]0.3158[/latex] |
| [latex]5[/latex] | [latex]3[/latex] | [latex]\frac{3}{19}[/latex] | [latex]0.4737[/latex] |
| [latex]7[/latex] | [latex]2[/latex] | [latex]\frac{2}{19}[/latex] | [latex]0.5789[/latex] |
| [latex]10[/latex] | [latex]2[/latex] | [latex]\frac{2}{19}[/latex] | [latex]0.6842[/latex] |
| [latex]12[/latex] | [latex]2[/latex] | [latex]\frac{2}{19}[/latex] | [latex]0.7895[/latex] |
| [latex]15[/latex] | [latex]1[/latex] | [latex]\frac{1}{19}[/latex] | [latex]0.8421[/latex] |
| [latex]20[/latex] | [latex]1[/latex] | [latex]\frac{1}{19}[/latex] | [latex]1.0000[/latex] |
- Fix the errors in Table. Also, explain how someone might have arrived at the incorrect number(s).
- Explain what is wrong with this statement: “[latex]47[/latex] percent of the people surveyed have lived in the U.S. for [latex]5[/latex] years.”
- Fix the statement in b to make it correct.
- What fraction of the people surveyed have lived in the U.S. five or seven years?
- What fraction of the people surveyed have lived in the U.S. at most [latex]12[/latex] years?
- What fraction of the people surveyed have lived in the U.S. fewer than [latex]12[/latex] years?
- What fraction of the people surveyed have lived in the U.S. from five to [latex]20[/latex] years, inclusive?
| [latex]24.0[/latex] | [latex]24.3[/latex] | [latex]25.9[/latex] | [latex]18.9[/latex] | [latex]27.5[/latex] | [latex]17.9[/latex] | [latex]21.8[/latex] | [latex]20.9[/latex] | [latex]16.7[/latex] | [latex]27.3[/latex] |
| [latex]18.2[/latex] | [latex]24.7[/latex] | [latex]20.0[/latex] | [latex]22.6[/latex] | [latex]23.9[/latex] | [latex]18.0[/latex] | [latex]31.4[/latex] | [latex]22.3[/latex] | [latex]24.0[/latex] | [latex]25.5[/latex] |
| [latex]24.7[/latex] | [latex]24.6[/latex] | [latex]28.1[/latex] | [latex]24.9[/latex] | [latex]22.6[/latex] | [latex]23.6[/latex] | [latex]23.4[/latex] | [latex]25.7[/latex] | [latex]24.8[/latex] | [latex]25.5[/latex] |
| [latex]21.2[/latex] | [latex]25.7[/latex] | [latex]23.1[/latex] | [latex]23.0[/latex] | [latex]23.9[/latex] | [latex]26.0[/latex] | [latex]16.3[/latex] | [latex]23.1[/latex] | [latex]21.4[/latex] | [latex]21.5[/latex] |
| [latex]27.0[/latex] | [latex]27.0[/latex] | [latex]18.6[/latex] | [latex]31.7[/latex] | [latex]23.3[/latex] | [latex]30.1[/latex] | [latex]22.9[/latex] | [latex]23.3[/latex] | [latex]21.7[/latex] | [latex]18.6[/latex] |
| Age | Frequency | Relative Frequency | Cumulative Relative Frequency |
|---|---|---|---|
| 40–44 | [latex]3[/latex] | ||
| 45–49 | [latex]11[/latex] | ||
| 50–54 | [latex]13[/latex] | ||
| 55–59 | [latex]16[/latex] | ||
| 60–64 | [latex]10[/latex] | ||
| 65–69 | [latex]6[/latex] | ||
| 70–74 | [latex]1[/latex] |
- What is the frequency for CEO ages between [latex]54[/latex] and [latex]65[/latex]?
- What percentage of CEOs are [latex]65[/latex] years or older?
- What is the relative frequency of ages under [latex]50[/latex]?
- What is the cumulative relative frequency for CEOs younger than [latex]55[/latex]?
- Which graph shows the relative frequency and which shows the cumulative relative frequency?
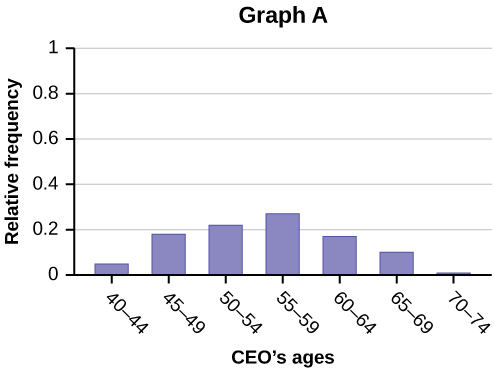
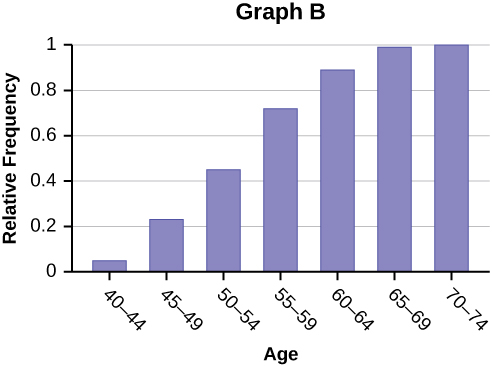
Use the following information to answer the next two exercises: the table below contains data on hurricanes that have made direct hits on the U.S. Between 1851 and 2004. A hurricane is given a strength category rating based on the minimum wind speed generated by the storm.
| Category | Number of Direct Hits | Relative Frequency | Cumulative Frequency |
|---|---|---|---|
| Total = [latex]273[/latex] | |||
| [latex]1[/latex] | [latex]109[/latex] | [latex]0.3993[/latex] | [latex]0.3993[/latex] |
| [latex]2[/latex] | [latex]72[/latex] | [latex]0.2637[/latex] | [latex]0.6630[/latex] |
| [latex]3[/latex] | [latex]71[/latex] | [latex]0.2601[/latex] | |
| [latex]4[/latex] | [latex]18[/latex] | [latex]0.9890[/latex] | |
| [latex]5[/latex] | [latex]3[/latex] | [latex]0.0110[/latex] | [latex]1.0000[/latex] |
- [latex]0.0768[/latex]
- [latex]0.0659[/latex]
- [latex]0.2601[/latex]
- Not enough information to calculate
93. What is the relative frequency of direct hits that were AT MOST a category [latex]3[/latex] storm?
- [latex]0.3480[/latex]
- [latex]0.9231[/latex]
- [latex]0.2601[/latex]
- [latex]0.3370[/latex]
Experimental Design and Ethics
- Inmates in a correctional facility are offered good behavior credit in return for participation in a study.
- A research study is designed to investigate a new children’s allergy medication.
- Participants in a study are told that the new medication being tested is highly promising, but they are not told that only a small portion of participants will receive the new medication. Others will receive placebo treatments and traditional treatments.
Use key terms from this module to describe the design of this experiment.
Candela Citations
- Introductory Statistics . Authored by: Barbara Illowski, Susan Dean. Provided by: Open Stax. Located at: http://cnx.org/contents/30189442-6998-4686-ac05-ed152b91b9de@17.44. License: CC BY: Attribution. License Terms: Download for free at http://cnx.org/contents/30189442-6998-4686-ac05-ed152b91b9de@17.44