Why learn to make inferences about two populations?
The concepts discussed in the module Hypothesis Testing with One Sample can be applied to situations involving two samples. The reason we can do this is due to the following big ideas:
- Random samples vary. When we use a sample proportion or sample mean to make an inference about a population proportion or population mean, there is uncertainty. For this reason, inference involves probability.
- Under certain conditions, we can model the variability in sample proportions or sample means with a normal curve. We use the normal curve to make probability-based decisions about population values.
- We can estimate a population proportion or a population mean with a confidence interval. The confidence interval is an actual sample proportion or sample mean plus or minus a margin of error. We state our confidence in the accuracy of these intervals using probability.
- We can test a hypothesis about a population proportion or population mean using a sample proportion or a sample mean. Again, we base our conclusion on probability using a P-value. The P-value describes the strength of our evidence in rejecting a hypothesis about the population.
In Hypothesis Testing with Two Samples, we extend these big ideas to make inferences that compare two populations (or two treatments). An example of such an inference follows:
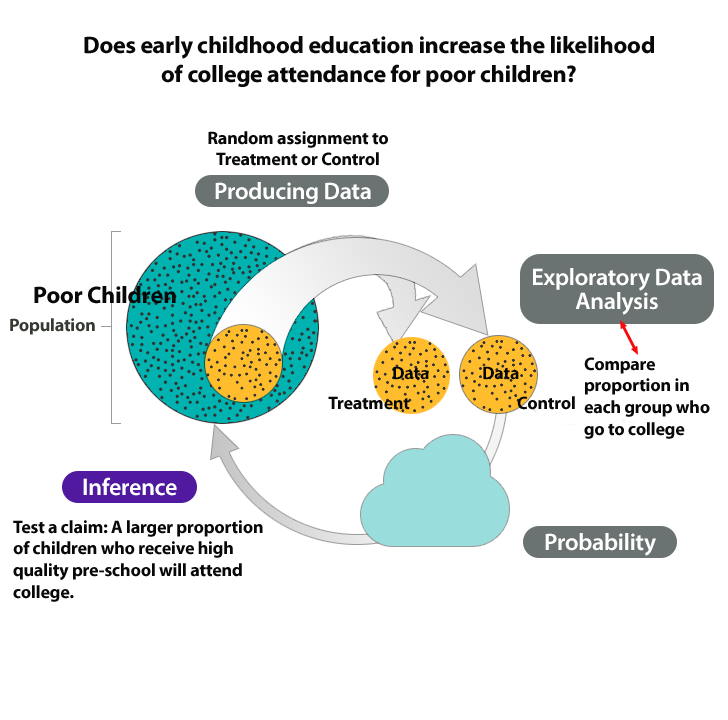
Example
The Abecedarian Early Intervention Project
In the 1970s, Abecedarian Early Intervention Project studied the long-term effects of early childhood education for poor children.
Research question: Does early childhood education increase the likelihood of college attendance for poor children?
- Produce Data: Determine what to measure, then collect the data. In this experiment, researchers selected 111 high-risk infants on the basis of the mothers’ education, family income, and other factors. They randomly assigned 57 infants to receive 5 years of high-quality preschool. The remaining 54 infants were a control group. All children received nutritional supplements, social services, and health care to control the effects of these confounding factors on the outcomes of the experiment.
- Exploratory Data Analysis: Analyze and summarize the data. By the age of 21 a much higher percentage of the treatment group enrolled in college, 42% vs. 20%.
- Draw a Conclusion: Use data, probability, and statistical inference to draw a conclusion about the populations. Is this difference statistically significant? In other words, is this difference due to the pre-school experience or due to chance? We will test the claim that a larger proportion of children who attend pre-school will attend college.
The following figure summarizes this investigation in the Big Picture.
Candela Citations
CC licensed content, Original
- Provided by: Lumen Learning. License: CC BY: Attribution
CC licensed content, Shared previously
- Concepts in Statistics. Provided by: Open Learning Initiative. Located at: http://oli.cmu.edu. License: CC BY: Attribution
