Learning Outcomes
- Draw a tree diagram to represent a given scenario
- Use a tree diagram to calculate probabilities
Sometimes, when the probability problems are complex, it can be helpful to graph the situation. Tree diagrams and Venn diagrams are two tools that can be used to visualize and solve conditional probabilities.
Tree Diagrams
A tree diagram is a special type of graph used to determine the outcomes of an experiment. It consists of “branches” that are labeled with either frequencies or probabilities. Tree diagrams can make some probability problems easier to visualize and solve. The following example illustrates how to use a tree diagram.
Example
In an urn, there are [latex]11[/latex] balls. Three balls are red ([latex]R[/latex]) and eight balls are blue ([latex]B[/latex]). Draw two balls, one at a time, with replacement. “With replacement” means that you put the first ball back in the urn before you select the second ball. The tree diagram using frequencies that show all the possible outcomes follows.

The first set of branches represents the first draw. The second set of branches represents the second draw. Each of the outcomes is distinct. In fact, we can list each red ball as [latex]R1[/latex], [latex]R2[/latex], and [latex]R3[/latex] and each blue ball as [latex]B1[/latex], [latex]B2[/latex], [latex]B3[/latex], [latex]B4[/latex], [latex]B5[/latex], [latex]B6[/latex], [latex]B7[/latex], and [latex]B8[/latex]. Then the nine [latex]RR[/latex] outcomes can be written as:
[latex]R1R1;\,\, R1R2;\,\, R1R3;\,\, R2R1;\,\, R2R2;\,\, R2R3;\,\, R3R1;\,\, R3R2;\,\, R3R3[/latex]
The other outcomes are similar.
There are a total of [latex]11[/latex] balls in the urn. Draw two balls, one at a time, with replacement. There are [latex]11(11) = 121[/latex] outcomes, the size of the sample space.
- List the [latex]24[/latex] [latex]BR[/latex] outcomes: [latex]B1R1[/latex], [latex]B1R2[/latex], [latex]B1R3[/latex], …
- Using the tree diagram, calculate [latex]P(RR)[/latex].
- Using the tree diagram, calculate [latex]P(RB \text{ OR } BR)[/latex].
- Using the tree diagram, calculate [latex]P(R \text{ on 1st draw AND } B \text { on 2nd draw})[/latex].
- Using the tree diagram, calculate [latex]P(R \text{ on 2nd draw GIVEN } B \text { on 1st draw})[/latex].
- Using the tree diagram, calculate [latex]P(BB)[/latex].
- Using the tree diagram, calculate [latex]P(B \text{ on the 2nd draw given } R \text { on the first draw})[/latex].
Try It
In a standard deck, there are 52 cards. Twelve cards are face cards (event [latex]F[/latex]) and 40 cards are not face cards (event [latex]N[/latex]). Draw two cards, one at a time, with replacement. All possible outcomes are shown in the tree diagram as frequencies. Using the tree diagram, calculate [latex]P(FF)[/latex].

Example
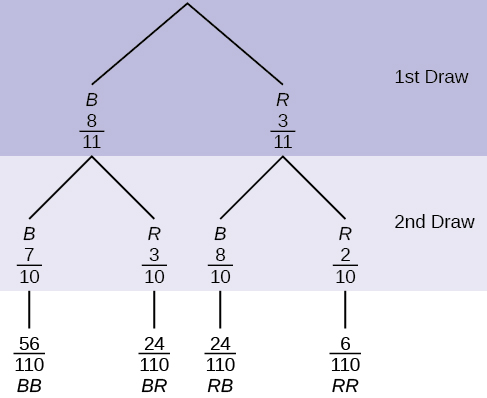
An urn has three red marbles and eight blue marbles in it. Draw two marbles, one at a time, this time without replacement, from the urn. Without replacement means that you do not put the first ball back before you select the second marble. Following is a tree diagram for this situation. The branches are labeled with probabilities instead of frequencies. The numbers at the ends of the branches are calculated by multiplying the numbers on the two corresponding branches, for example, [latex](\frac{3}{11})(\frac{2}{10})=(\frac{6}{110})[/latex].
Note
If you draw a red on the first draw from the three red possibilities, there are two red marbles left to draw on the second draw. You do not put back or replace the first marble after you have drawn it. You draw without replacement, so that on the second draw there are ten marbles left in the urn.
Calculate the following probabilities using the tree diagram.
a. [latex]P(RR)[/latex] = ________
b. Fill in the blanks:
[latex]P(RB \text{ OR } BR = (\frac{3}{11})(\frac{8}{10}) + (\rule{1cm}{0.15mm})(\rule{1cm}{0.15mm}) = \frac{48}{110}[/latex]
c. [latex]P(R \text{ on 2nd|}B \text{ on 1st}) =[/latex]
d. Fill in the blanks.
[latex]P(R \text{ on 1st AND } B \text{ on 2nd }) = P(RB) = (\rule{1cm}{0.15mm})(\rule{1cm}{0.15mm})= \frac{24}{110}[/latex]
e. Find [latex]P(BB)[/latex].
f. Find [latex]P(B \text{ on 2nd|}R \text{ on 1st})[/latex].
If we are using probabilities, we can label the tree in the following general way.
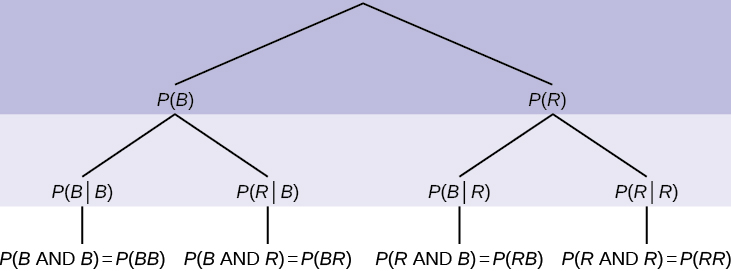
- [latex]P(RR)[/latex] here means [latex]P(R \text{ on 2nd|}R \text{ on 1st})[/latex]
- [latex]P(BR)[/latex] here means [latex]P(B \text{ on 2nd|}R \text{ on 1st})[/latex]
- [latex]P(RB)[/latex] here means [latex]P(R \text{ on 2nd|}B \text{ on 1st})[/latex]
- [latex]P(BB)[/latex] here means [latex]P(B \text{ on 2nd|}B \text{ on 1st})[/latex]
Try It
In a standard deck, there are 52 cards. Twelve cards are face cards [latex](F)[/latex] and 40 cards are not face cards [latex](N)[/latex]. Draw two cards, one at a time, without replacement. The tree diagram is labeled with all possible probabilities.

- Find [latex]P(FN \ \mathrm{OR} \ NF)[/latex].
- Find [latex]P(N|F)[/latex].
- Find [latex]P[/latex](at most one face card).
Hint: “At most one face card” means zero or one face card. - Find [latex]P[/latex](at least on face card).
Hint: “At least one face card” means one or two face cards.
Example
A litter of kittens available for adoption at the Humane Society has four tabby kittens and five black kittens. A family comes in and randomly selects two kittens (without replacement) for adoption.

- What is the probability that both kittens are tabby? a. [latex]( \frac{1}{2} )( \frac{1}{2} )[/latex] b. [latex]( \frac{4}{9} )( \frac{4}{9} )[/latex] c. [latex]( \frac{4}{9} )( \frac{3}{8} )[/latex] d. [latex]( \frac{4}{9} )( \frac{5}{9} )[/latex]
-
What is the probability that one kitten of each coloring is selected? a. [latex]( \frac{4}{9} )( \frac{5}{9} )[/latex] b. [latex]( \frac{4}{9} )( \frac{5}{8} )[/latex] c. [latex]( \frac{4}{9} )( \frac{5}{9} ) + ( \frac{5}{9} )( \frac{4}{9} )[/latex] d. [latex]( \frac{4}{9} )( \frac{5}{8} ) + ( \frac{5}{9} )( \frac{4}{8} )[/latex]
- What is the probability that a tabby is chosen as the second kitten when a black kitten was chosen as the first?
- What is the probability of choosing two kittens of the same color?
Try It
Suppose there are four red balls and three yellow balls in a box. Two balls are drawn from the box without replacement. What is the probability that one ball of each coloring is selected?
Candela Citations
- Statistics, Tree and Venn Diagrams. Provided by: OpenStax. Located at: https://openstax.org/books/statistics/pages/3-5-tree-and-venn-diagrams. License: CC BY: Attribution. License Terms: Access for free at https://openstax.org/books/statistics/pages/1-introduction
- Introductory Statistics. Authored by: Barbara Illowsky, Susan Dean. Provided by: Open Stax. Located at: https://openstax.org/books/introductory-statistics/pages/1-introduction. License: CC BY: Attribution. License Terms: Access for free at https://openstax.org/books/introductory-statistics/pages/1-introduction
- Count outcomes using tree diagram. Provided by: Khan Acadamy. Located at: https://www.khanacademy.org/math/cc-seventh-grade-math/cc-7th-probability-statistics/cc-7th-compound-events/v/tree-diagram-to-count-outcomes. License: CC BY-NC-SA: Attribution-NonCommercial-ShareAlike
- Prealgebra. Provided by: Open Stax. Located at: https://openstax.org/books/prealgebra/pages/1-introduction. License: CC BY: Attribution. License Terms: Access for free at https://openstax.org/books/prealgebra/pages/1-introduction
